
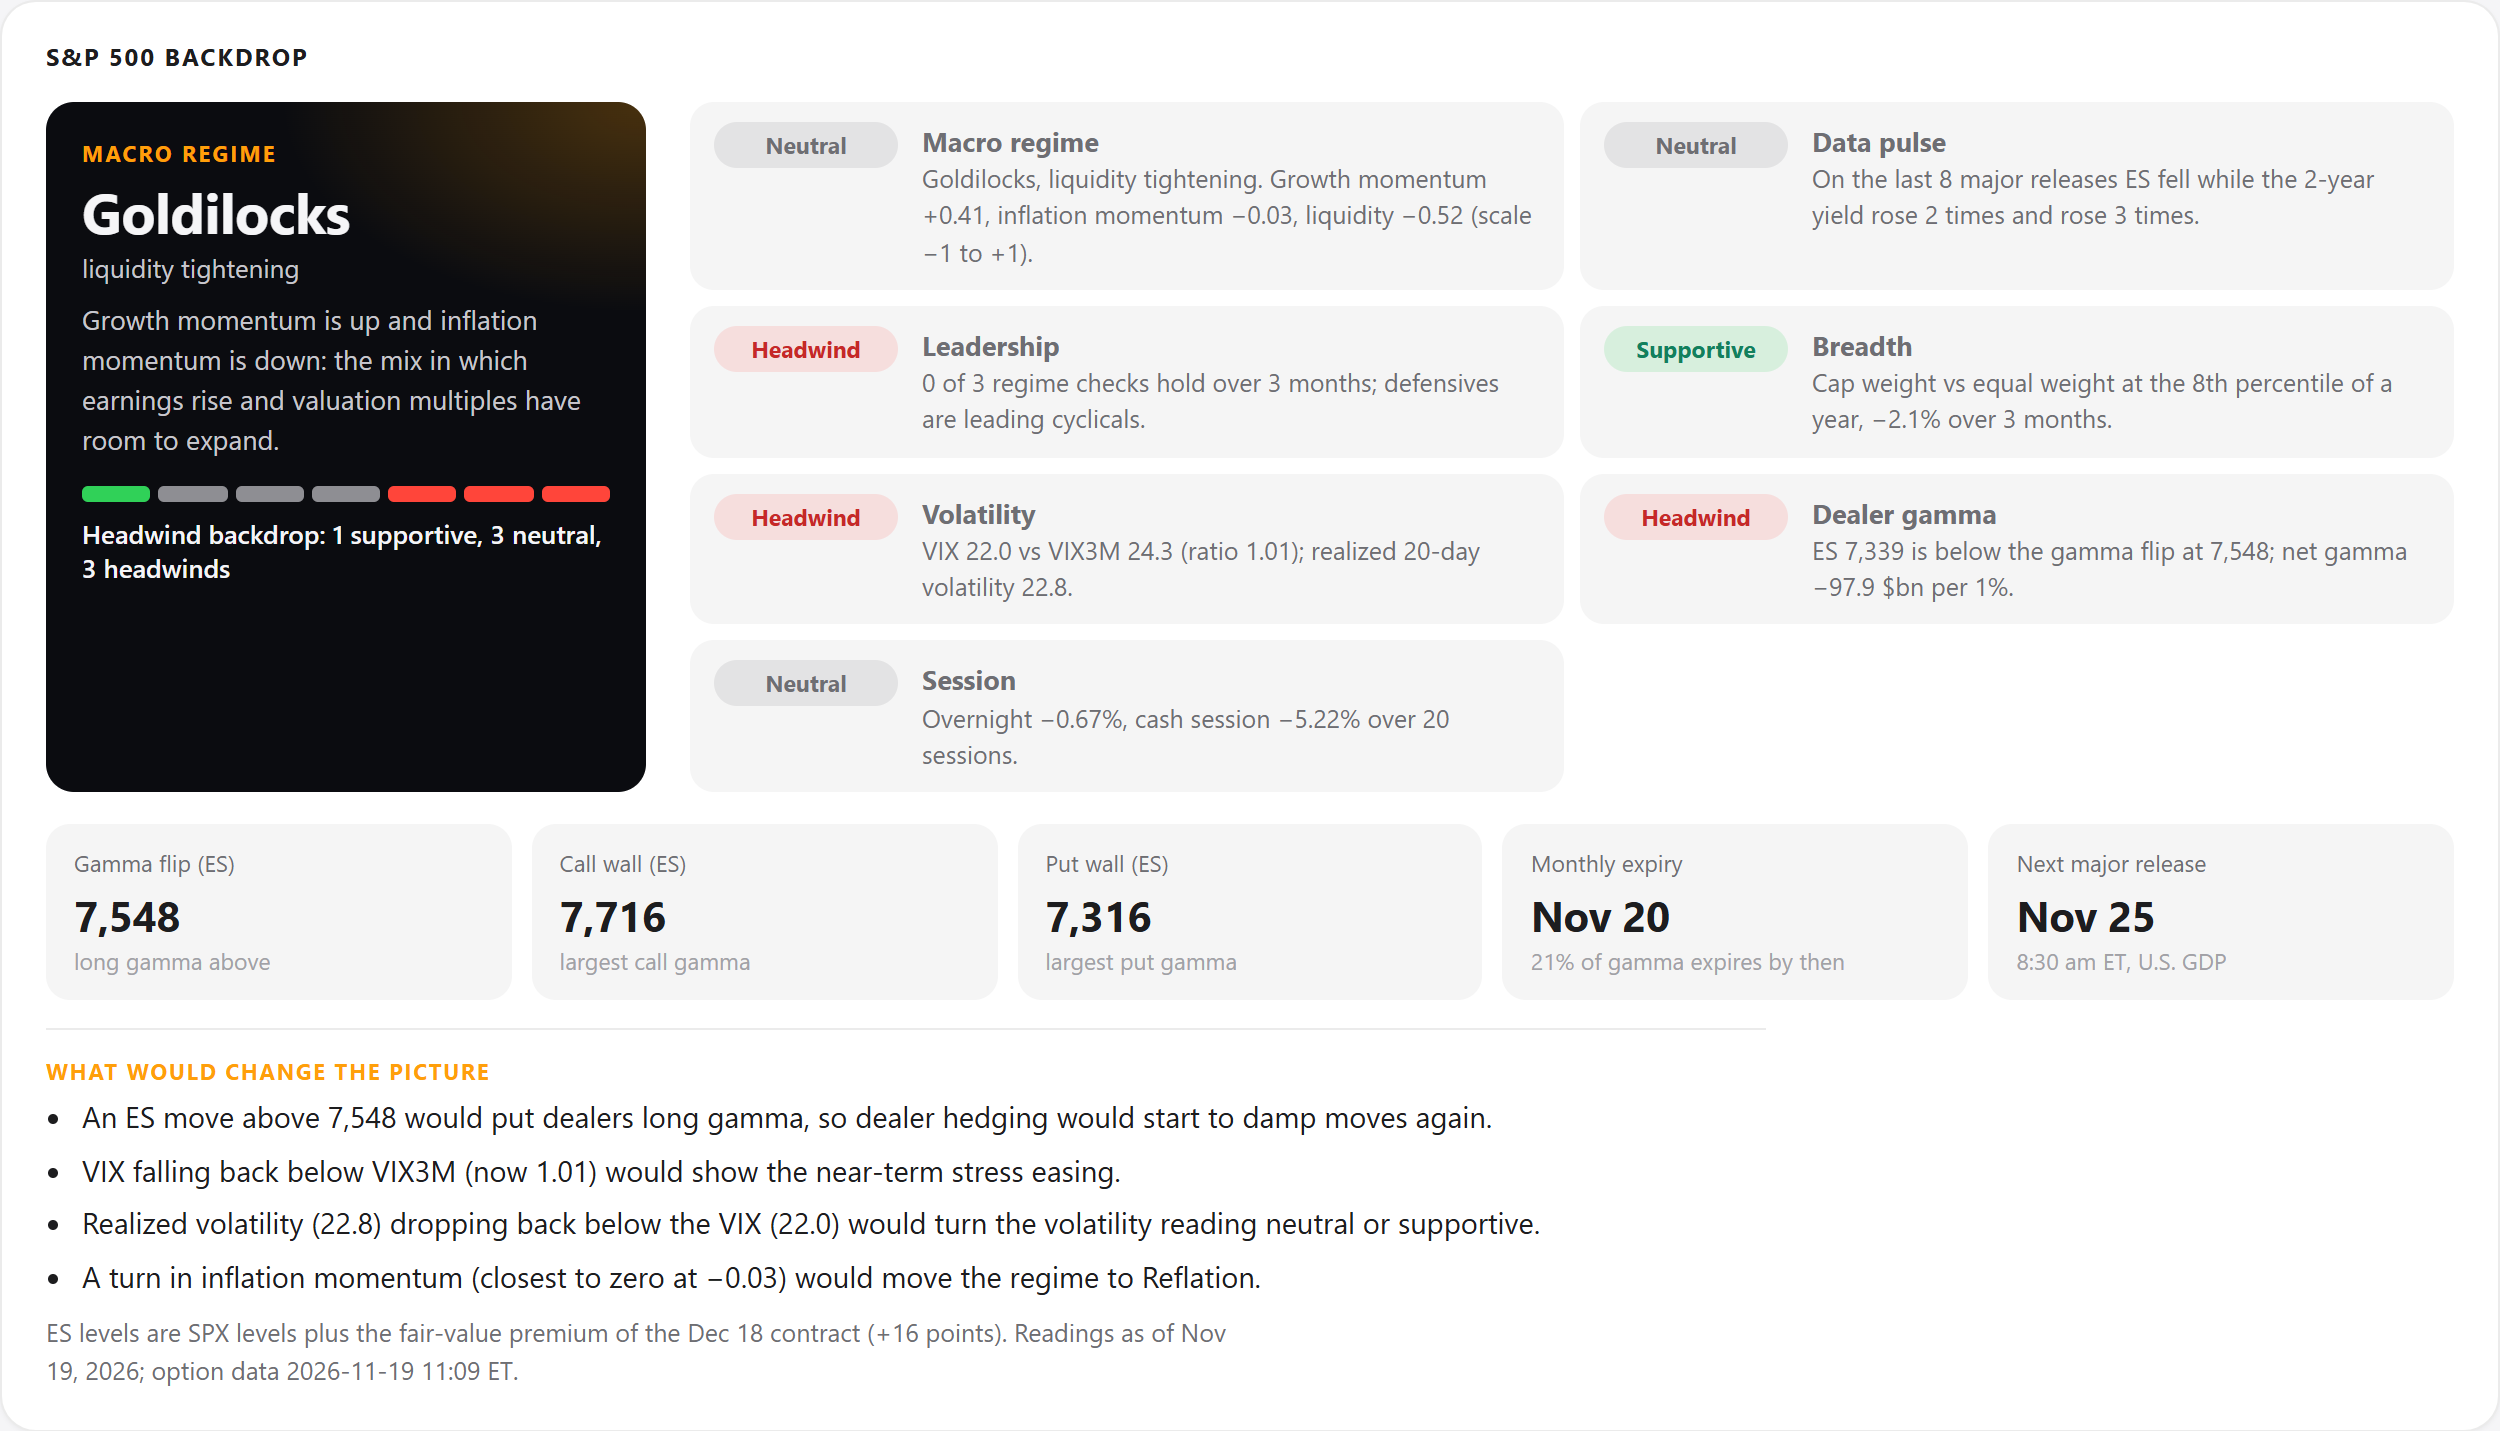
The S&P 500 closed Wednesday at 7,323.63, down 0.2%, and a seven-gauge framework that scores the index on macro regime, release-day reactions, leadership, breadth, volatility, dealer positioning and trading sessions reads the backdrop as a headwind: one gauge supportive, three neutral and three headwinds. The macro regime itself is “Goldilocks,” the mix of rising growth and easing inflation in which earnings have historically climbed and valuation multiples had room to expand. Two details undercut it: liquidity is tightening, and inflation momentum sits at −0.03, a hair from flipping the label to “Reflation.”
Growth momentum is +0.41 on a scale from −1 to +1. It draws on industrial production (up 0.9% at a three-month annualized rate and 2.1% on the year), real retail sales (+4.4% annualized, +2.6% on the year), payrolls (a 137,000 monthly gain over three months against 74,000 over twelve) and jobless claims (a 195,000 four-week average against 206,000 over 26 weeks). Inflation momentum is −0.03 because its inputs disagree: core CPI runs at a 3.75% annualized pace over three months against 2.87% on the year, which points up, while core PCE runs at 2.90% against 3.12% and the five-year breakeven has fallen 11 basis points in three months, which point down.
Liquidity scores −0.52. The Chicago Fed’s financial conditions index is at −0.48 and has risen 0.07 over 13 weeks, which means tighter. The high-yield spread is 343 basis points, up 68 over the same period, and the 10-year real yield is 2.89%, up 54 basis points. Net liquidity, the Fed’s assets less the Treasury’s account and reverse repo, runs against that trend: at $5.84 trillion it is up 0.91% over 13 weeks.
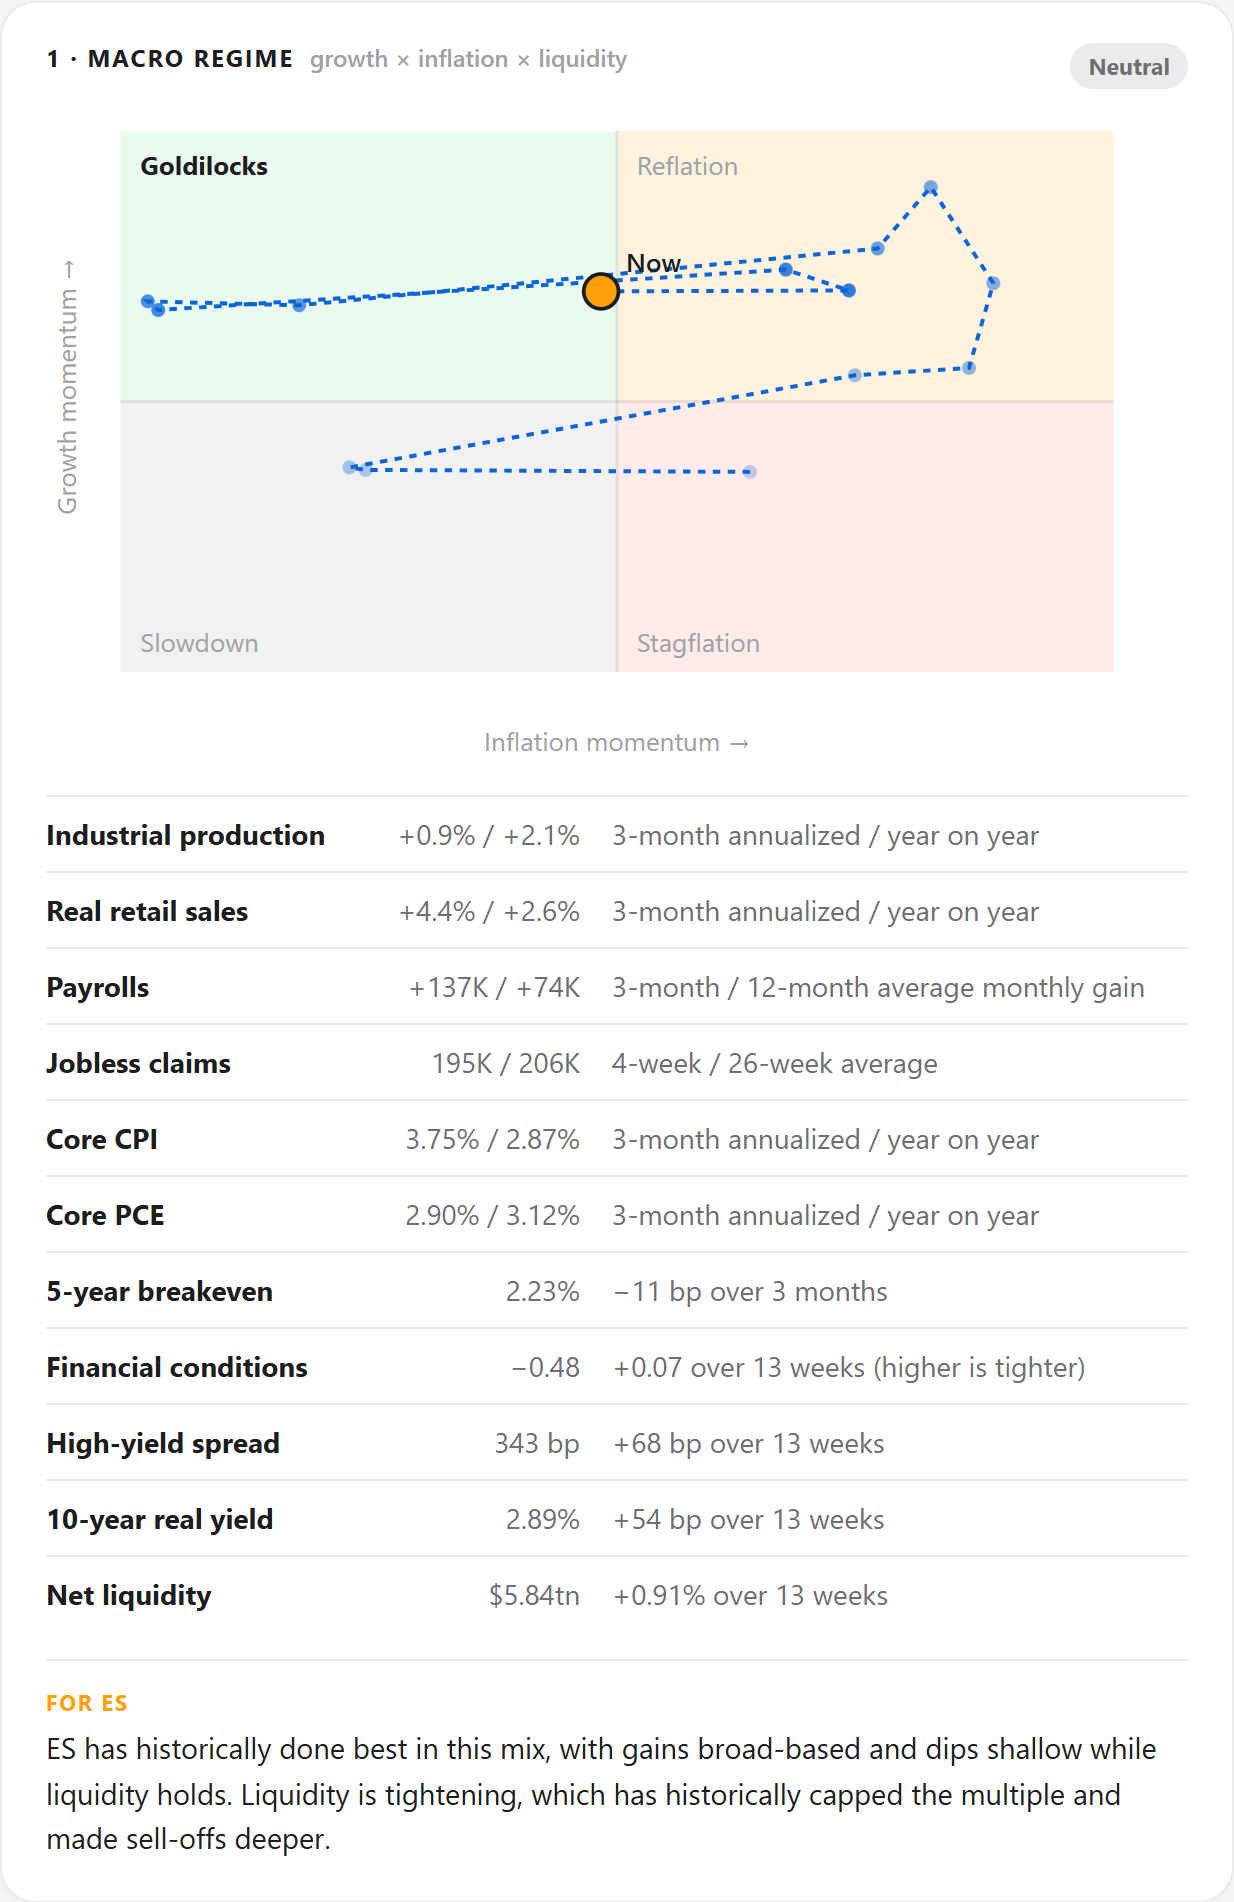
The trail on the map shows how little the label has held. The index spent January through May in Reflation, June through August in Goldilocks, when inflation momentum was between −0.64 and −0.95, and September and October back in Reflation, at +0.34 and +0.47. The latest reading has moved to the left edge of the line. For the S&P 500, the framework’s reading is that the index has historically done best in the Goldilocks mix, with broad gains and shallow dips while liquidity holds, and that tightening liquidity has historically capped the multiple and made sell-offs deeper.
Release days have not followed a rates-driven pattern. Across the last eight major releases the index fell 1.03% on the Nov. 17 retail sales report, 0.38% on the Nov. 10 CPI report, 1.11% on the Oct. 14 CPI report and 0.30% on Oct. 29, when GDP and PCE inflation came together. It rose 0.31% on the Nov. 6 payrolls report, 0.33% on Oct. 15 retail sales and 0.28% on the Oct. 28 Fed decision. The two-year yield rose 17 basis points on the November CPI report but fell 3 basis points on retail sales, when the index lost 1.03%.
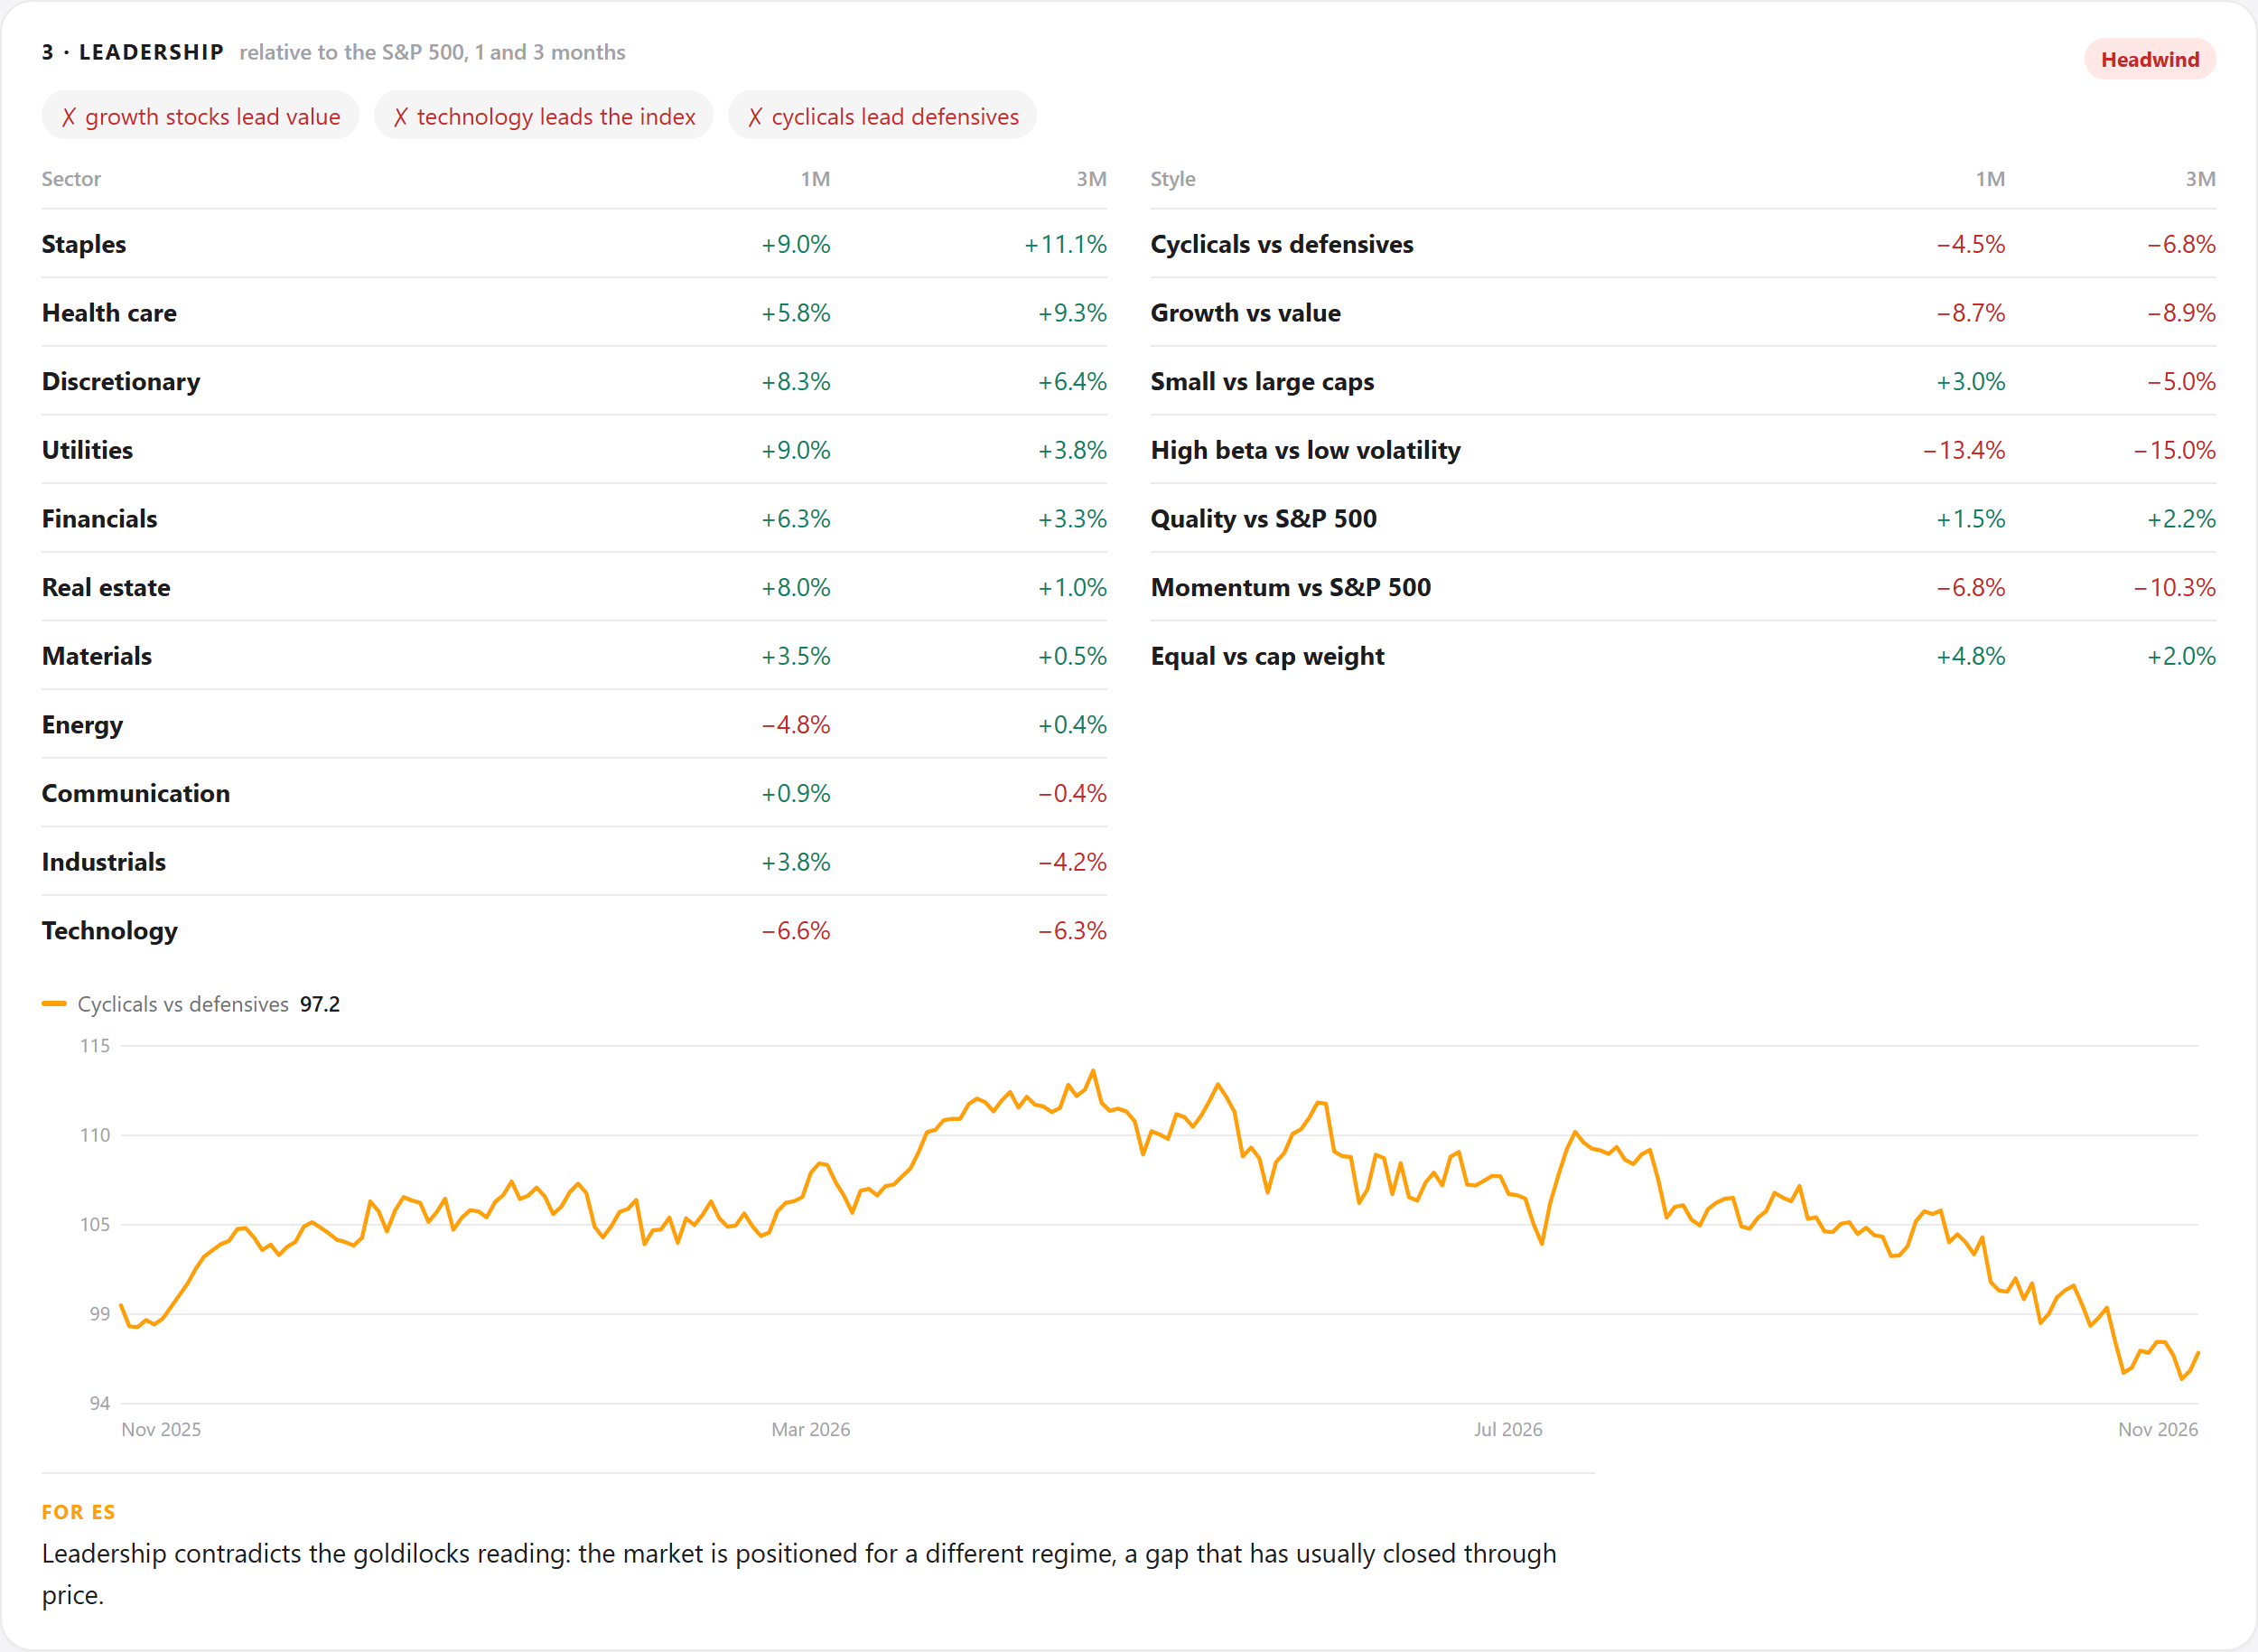
Leadership is where the framework finds its sharpest contradiction. None of its three regime checks holds over three months: growth stocks trail value by 8.9%, technology trails the index by 6.3% and cyclicals trail defensives by 6.8%. Relative to the S&P 500 over three months, consumer staples are ahead 11.1%, health care 9.3% and utilities 3.8%, while high-beta stocks have lagged low-volatility ones by 15.0% and the momentum factor by 10.3%. A market rewarding defensives is pricing a different regime from the one the macro data describe, a gap the framework says has usually closed through price.
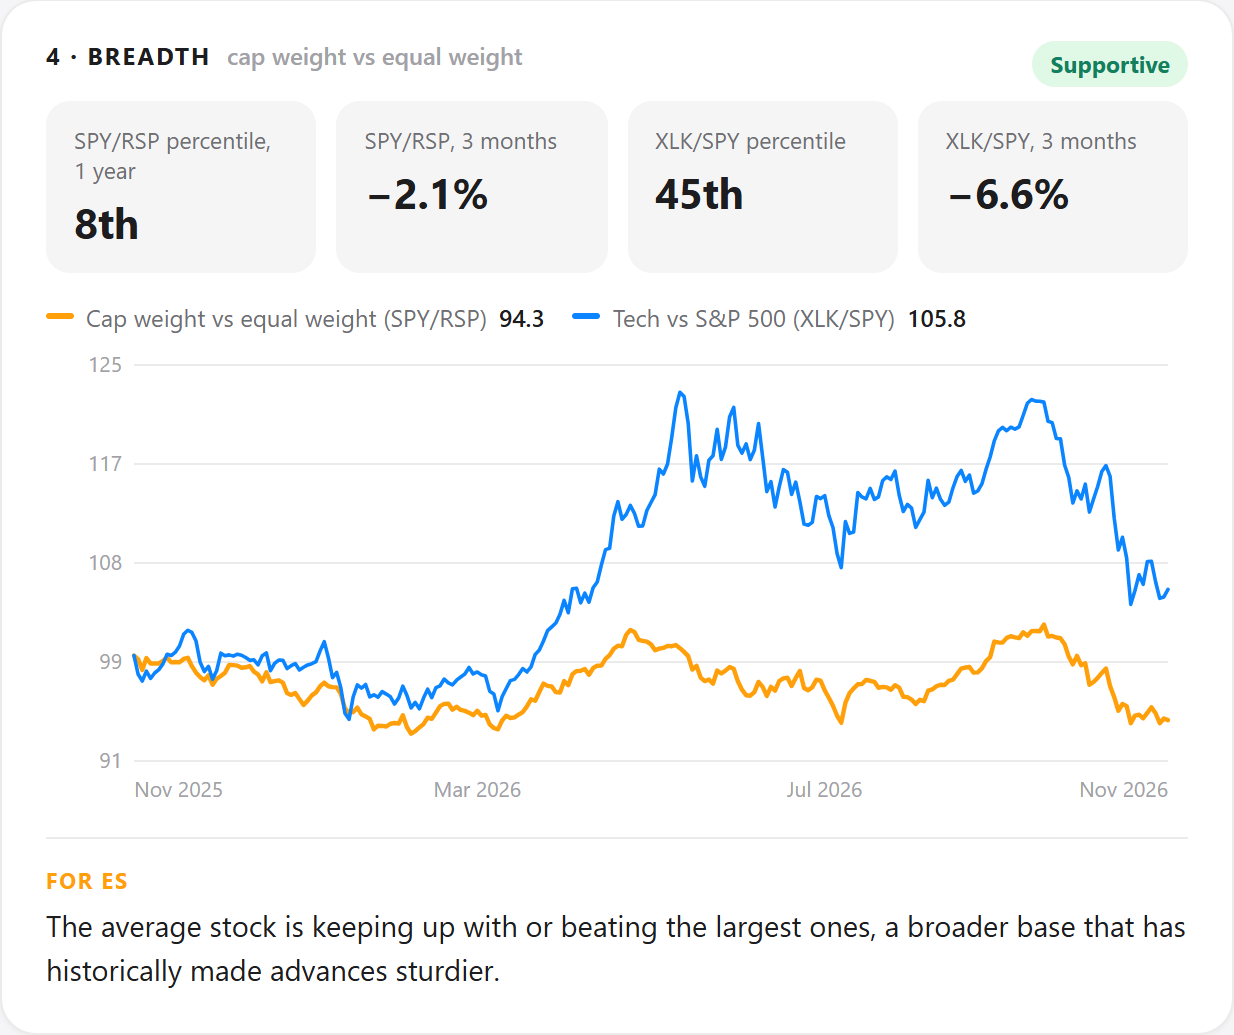
Breadth is the only supportive gauge, and it points the other way from leadership. The cap-weighted-to-equal-weight ratio (SPY against RSP) sits at the 8th percentile of the past year and is down 2.1% over three months, and the equal-weight index has beaten the cap-weighted one by 4.8% over the last month and 2.0% over three. Technology against the index is down 6.6% over three months but at the 45th percentile of its year. The framework reads this as the average stock keeping up with the largest ones, a broader base that has historically made advances sturdier.
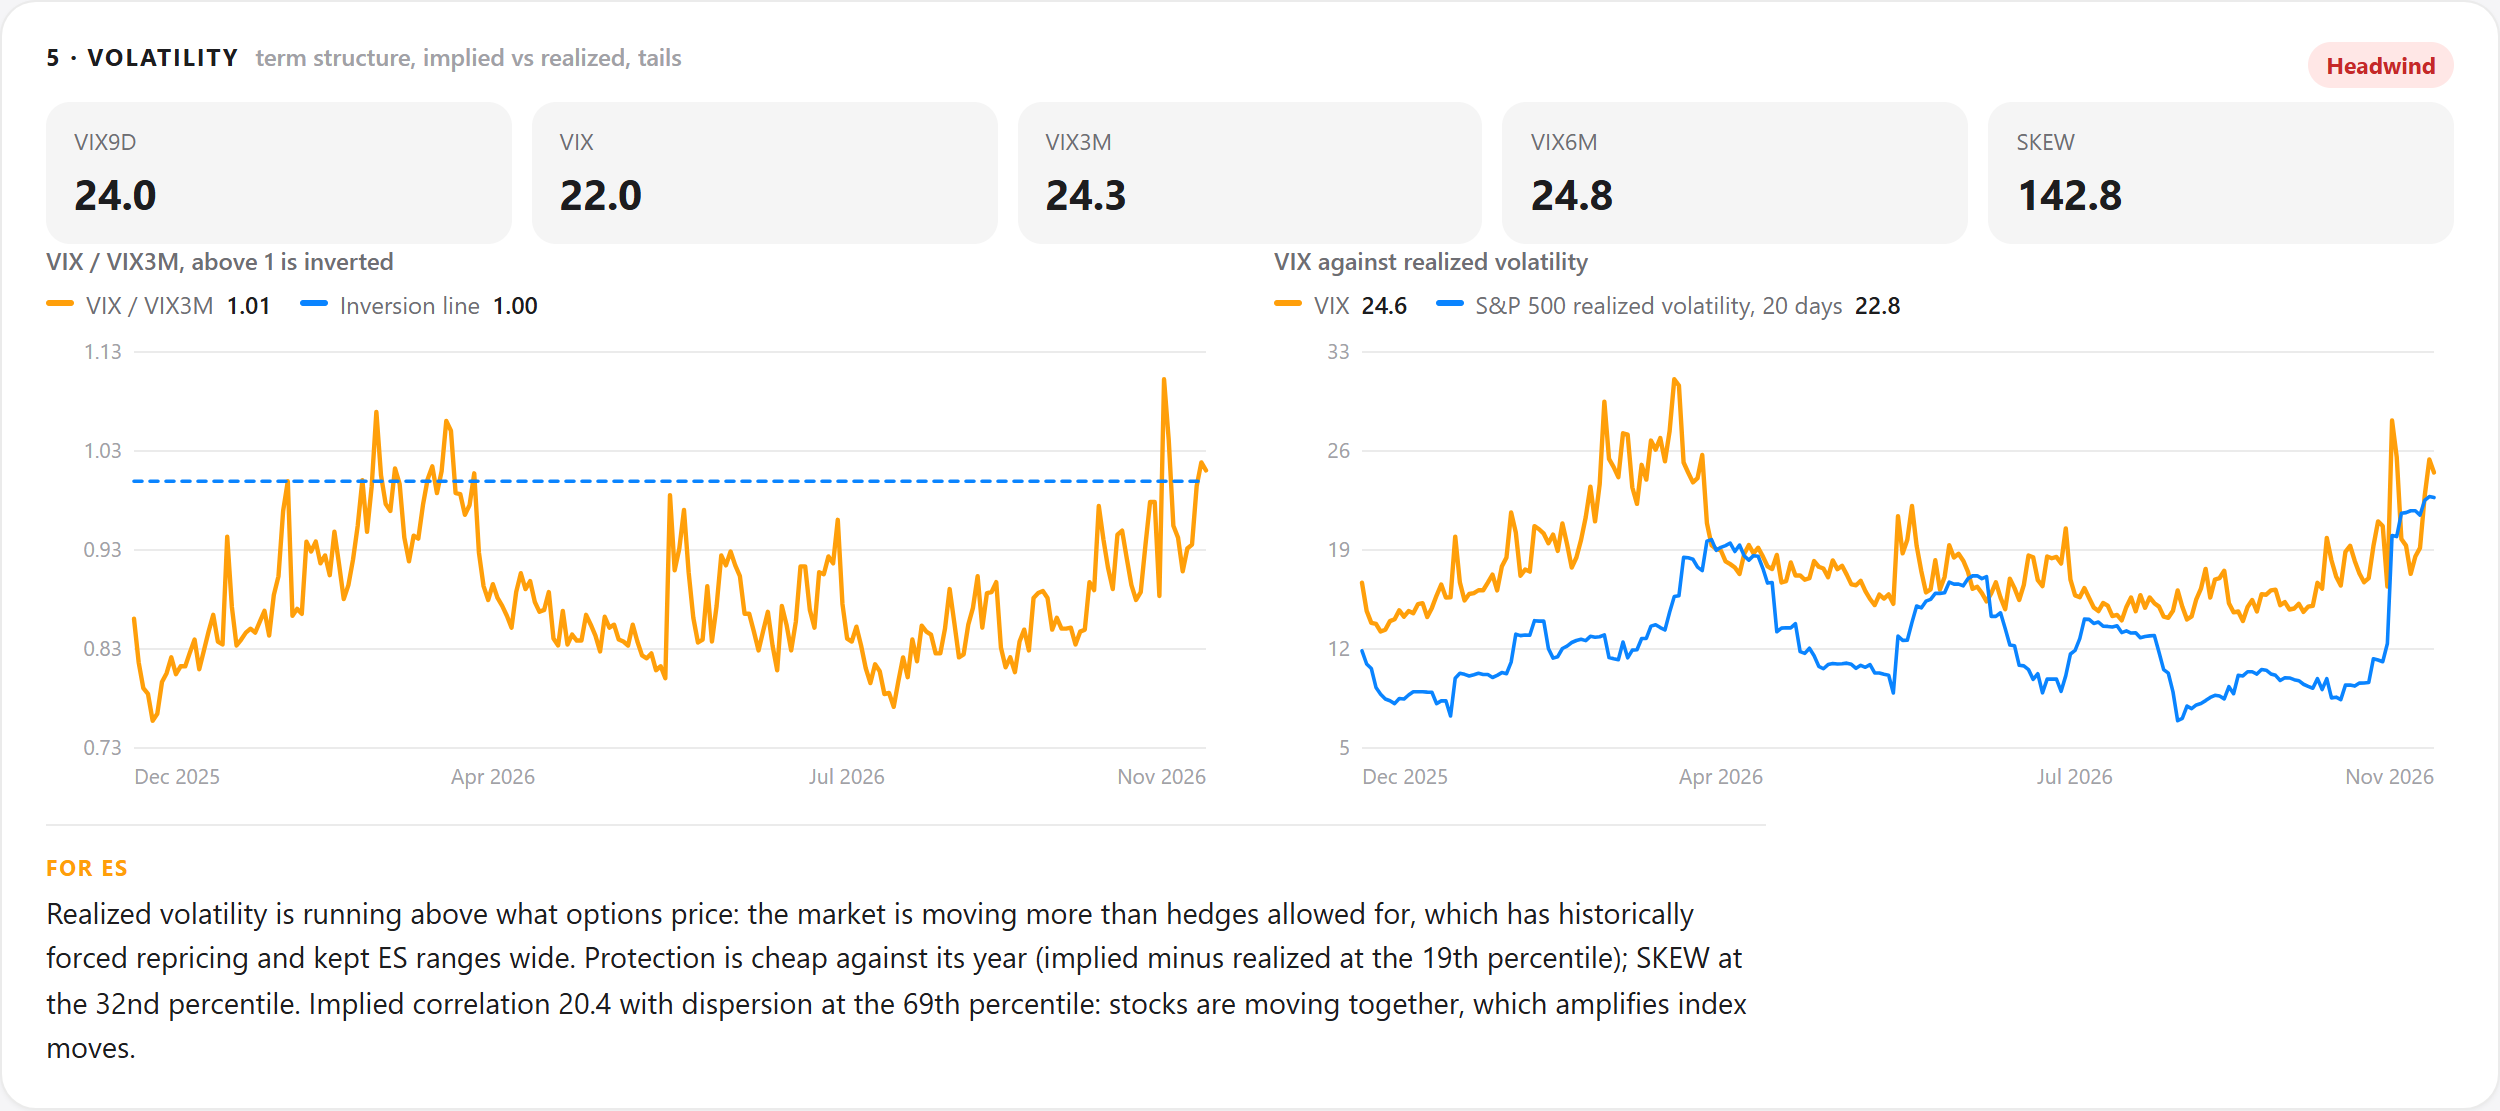
Volatility scores as a headwind on term structure. The VIX closed Wednesday at 24.6, above the three-month VIX at 24.3, a ratio of 1.01 that marks an inverted curve; the nine-day index is at 24.0 and the six-month at 24.8. The VIX has since eased to about 22, and 20-day realized volatility is 22.8, so the market has been moving by more than the VIX priced at Thursday’s level. Against that, protection is cheap by the year’s standards: implied minus realized volatility is at the 19th percentile, and the SKEW index, at 142.8, is at the 32nd. The contrarian point is that the options market is not paying up for hedges even with the curve inverted.
Dealer positioning is the gauge with the most specific levels. Using the SPX options chain, and the usual convention that dealers are long the calls and short the puts investors trade, net gamma at spot is −97.9 billion dollars per 1% move. The gamma flip, the level above which dealers turn net long gamma, is at ES 7,548. The largest call concentration is at 7,716 and the largest put concentration at 7,316. ES levels are SPX levels plus the 15.8-point fair-value premium of the December contract, which puts the Wednesday close at ES 7,339. Below the flip, dealer hedging has usually added to moves, selling into declines and buying into rallies, so ranges tend to widen. Futures rose about 1.2% early Thursday to near 7,430, between the put wall and the flip.
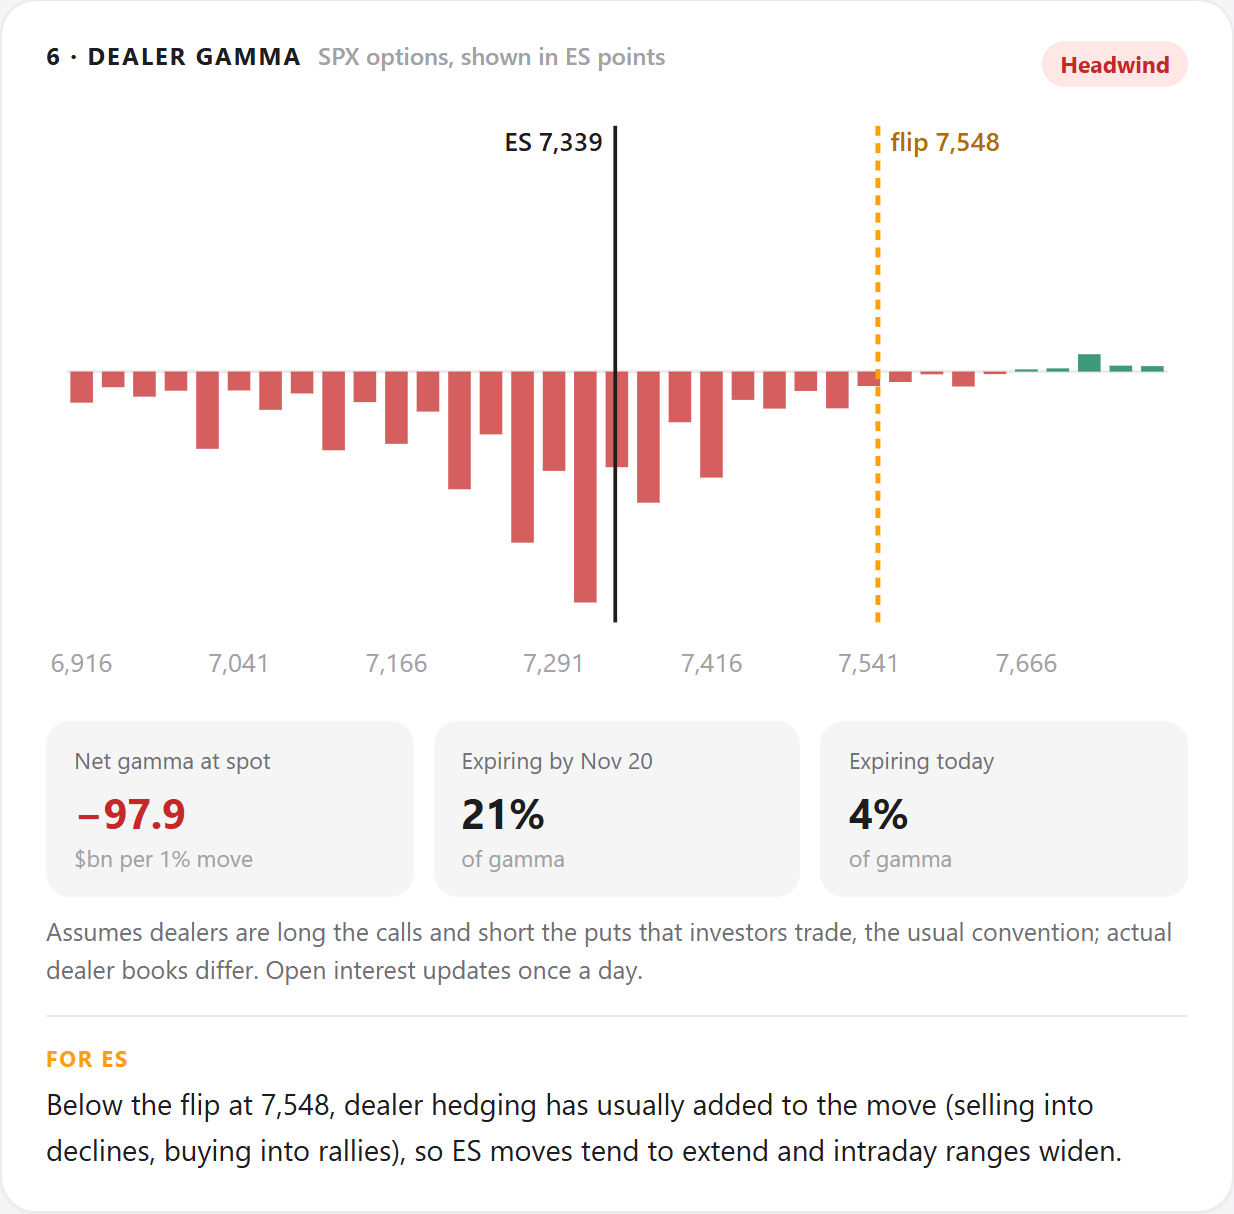
Timing matters for that gamma map. Open interest updates once a day, 4% of the gamma expires today, and 21% expires with the monthly SPX options on Friday, Nov. 20, so the levels can shift after the expiry even if the index does not move.

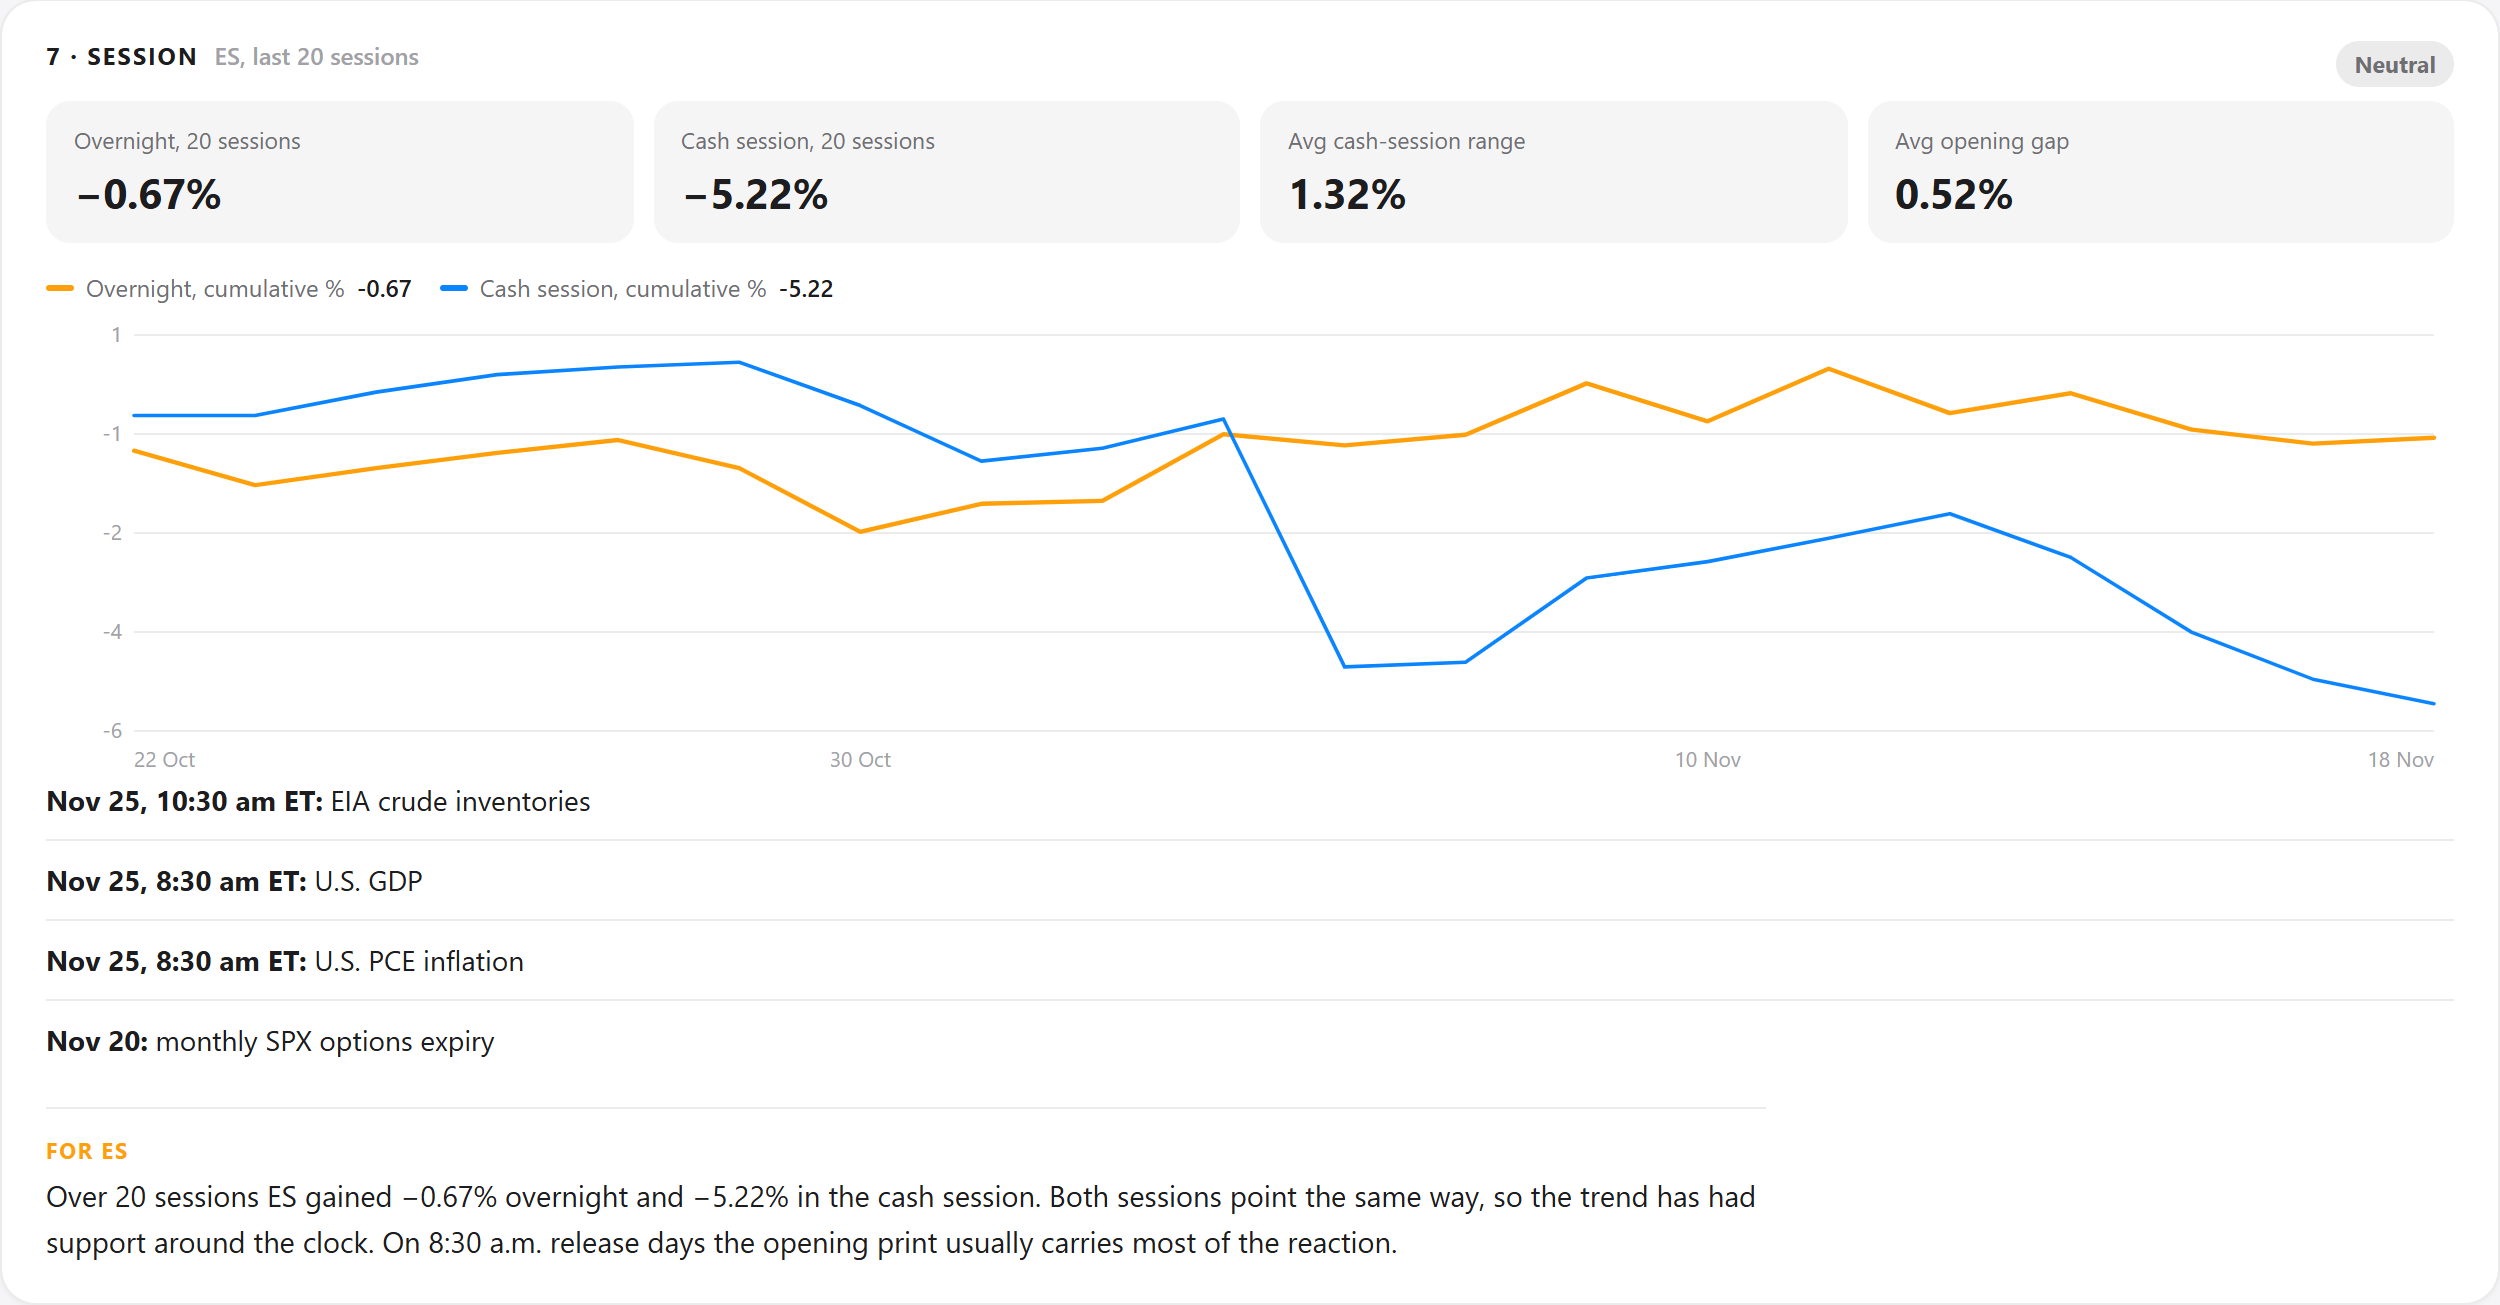
The session gauge is neutral but not benign. Over the last 20 sessions ES has lost 0.67% overnight and 5.22% in the cash session, with an average cash-session range of 1.32% and an average opening gap of 0.52%. Both sessions are down, so selling has had support around the clock, and on 8:30 a.m. release days the opening print has usually carried most of the reaction.
The framework does not publish a point forecast, and nothing here is one. What it offers are tendencies and conditions. Four developments would change the picture: an ES move above 7,548 would put dealers long gamma and start to damp moves; a VIX that fell back below the three-month VIX would show near-term stress easing; realized volatility dropping back below the VIX would turn the volatility gauge neutral or supportive; and a turn in inflation momentum from −0.03 would move the regime to Reflation. With inflation momentum at −0.03, a modest uptick would flip the label and a modest decline would move it further into Goldilocks.
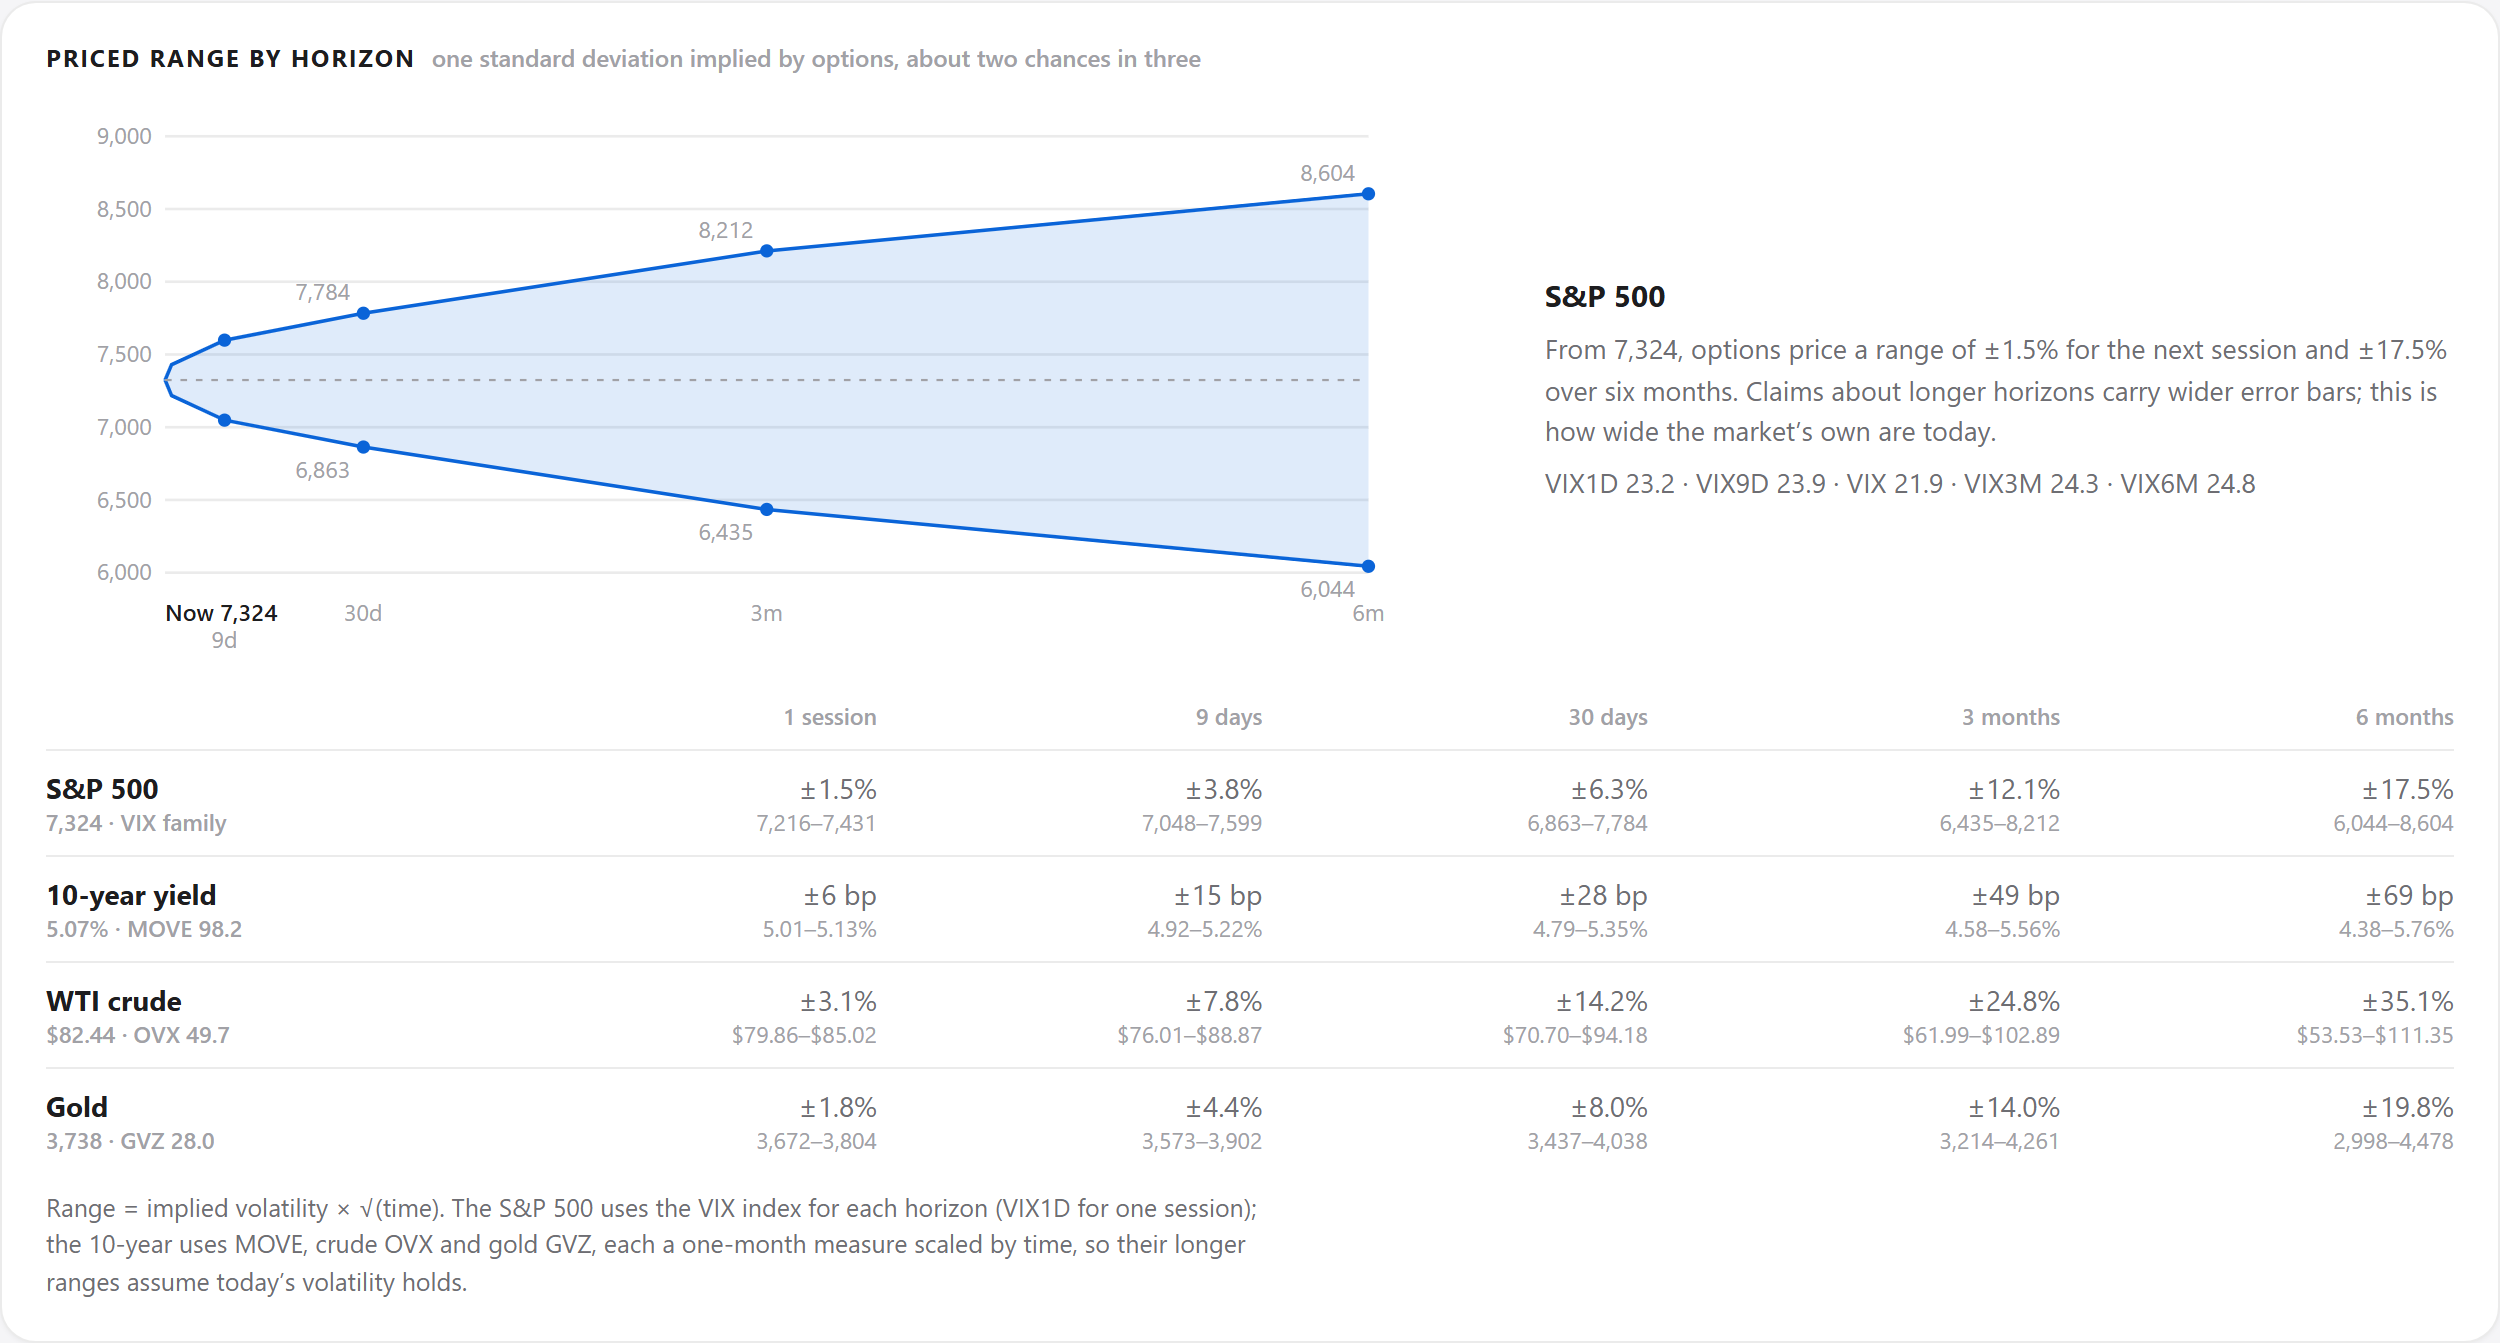
Options provide the only market-implied projection. Using the VIX family for each horizon, a one-standard-deviation range, about two chances in three, runs from 7,216 to 7,431 over the next session, 7,048 to 7,599 over nine days, 6,863 to 7,784 over 30 days, 6,435 to 8,212 over three months and 6,044 to 8,604 over six months. Those are ranges of ±1.5%, ±3.8%, ±6.3%, ±12.1% and ±17.5%, and they assume today’s volatility persists. The next scheduled tests are Friday’s options expiry, U.S. GDP and PCE inflation at 8:30 a.m. ET on Nov. 25, and the Fed decision on Dec. 9 followed by CPI on Dec. 10.
The full S&P 500 regime readout, with its scoring thresholds and levels refreshed from the latest data, is on The Desk.
Sources: fred.stlouisfed.org, U.S. Bureau of Labor Statistics, U.S. Bureau of Economic Analysis, cboe.com.