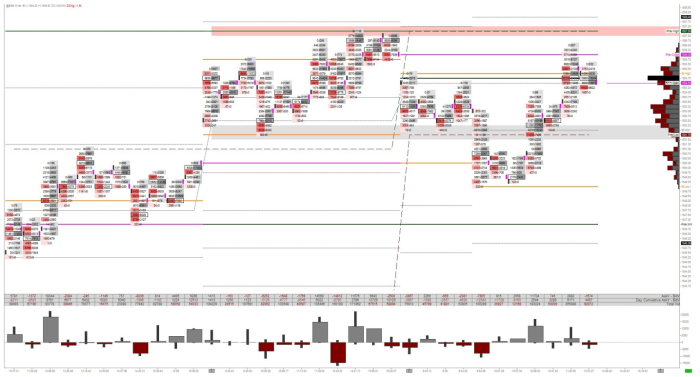
The Volume at Price indicator is a tool that allows the user the ability to view the market auction process in real time detailing the supply and demand of the market. There are many variations of the Volume at Price tool that the user can customize to their preference. Some examples are viewing the volume printing at the bid vs. the ask, the total volume printing at each price level and the delta at each price level to name a few. I will go into each of these examples in more detail in this presentation with visual references.
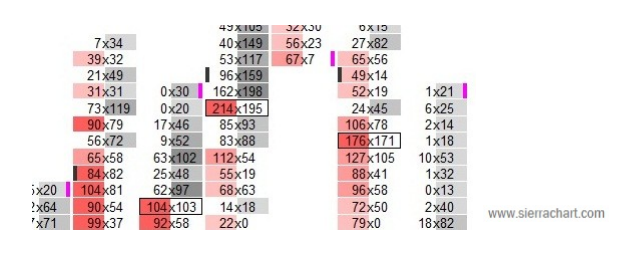
The benefits to this tool are that it allows the user to see the volume printing while gauging the tone of the order flow. It allows the user to see inside of each price bar that is formed and creates a clearer understanding of the market’s context. It is not a method of trading the market, it is just another way to frame the information that is being displayed which can help with your trade management decision process.
The Volume at Price tool also known as the “Footprint” was created by Market Delta and has been adapted by other charting software providers to provide a similar tool. These providers include in addition to Market Delta, Sierra Chart, eSignal and MultiCharts. There are also many 3rd party programmers that have created something similar through the NinjaTrader platform with the most notable being, Rancho Dinero/Acme Market Analytics.
Who is the Volume at Price tool best for? In my opinion, this tool not only benefits those that are very knowledgeable with the markets, it also benefits those that are just starting out as well in that they will learn to read and understand the market correctly. The concept is a bit advanced at first but once the basics are understood, it will change the way in which you look at the markets in real time.
What do we look for with the VaP tool? Generally speaking, we are looking for signs of change in the order flowactivity. These signs appear in the form of passive and aggressive market participants as seen through the different order types that are entering into the market at key support and resistance levels. This presentation will go into detail on how to identify these key elements by using the Volume at Price tool.