
Let’s dive into the world of credit spreads and how they can serve as a powerful tool for trading the S&P 500 (SPX), especially when viewed through the lens of the credit cycle. Imagine the credit cycle as a heartbeat of the economy, pulsing through periods of expansion and contraction, and credit spreads as a stethoscope that lets you listen to its rhythm. By understanding this, you can gain an edge in anticipating SPX movements.
First, let’s unpack what a credit spread is. In simple terms, a credit spread is the difference in yield between two types of bonds, typically a riskier corporate bond and a safer benchmark like a U.S. Treasury bond of similar maturity. For example, you might compare the yield on a high-yield corporate bond to a 10-year Treasury note. If the corporate bond yields 6% and the Treasury yields 2%, the credit spread is 4%. This spread reflects the extra compensation investors demand for taking on the risk of a company potentially defaulting. When spreads are narrow, it signals confidence in the economy, investors feel comfortable lending to companies. When spreads widen, it’s a sign of caution, as investors demand more yield to offset perceived risks.
Now, why does this matter for trading the SPX? The S&P 500, as a broad index of 500 large U.S. companies, is deeply tied to the health of the economy. Corporate earnings, investor sentiment, and economic conditions all influence stock prices, and these factors are mirrored in the bond market. Credit spreads act like a window into the bond market’s expectations, which often move in sync with, or even ahead of, the stock market. When credit spreads tighten, it suggests companies are seen as financially stable, borrowing costs are low, and economic growth is likely strong, bullish conditions for the SPX. Conversely, widening spreads indicate rising fears of default, higher borrowing costs, and potential economic slowdown, which can weigh on stocks.
To understand how credit spreads fit into the credit cycle, picture the economy as moving through phases like seasons. The credit cycle has four main stages: expansion, peak, contraction, and trough. During expansion, economic activity is robust, companies borrow easily, and credit spreads narrow as investors trust that defaults are unlikely. This is typically a great time for the SPX, as corporate profits grow and stock prices climb. At the peak, optimism might overheat, and spreads can start to widen slightly as risks creep in. During contraction, economic growth slows, defaults rise, and spreads widen significantly, often signaling trouble for equities. Finally, at the trough, the economy bottoms out, but spreads may begin to narrow again as recovery takes hold, setting the stage for the next bull run in stocks.
For traders, credit spreads are a leading indicator because bond markets often react faster than stocks to shifts in economic conditions. The bond market is like the quiet, analytical sibling of the stock market’s excitable personality. By watching spreads, you can get a heads-up on potential SPX moves. For instance, if you notice high-yield credit spreads (like those tracked by the ICE BofA High Yield Index) starting to widen while the SPX is still rallying, it could be a warning that the market is ignoring rising risks. This happened in late 2007, when spreads began to widen months before the SPX peaked, foreshadowing the 2008 financial crisis. On the flip side, narrowing spreads in early 2009 signaled improving conditions, even as stocks were still volatile.
So, how can you use credit spreads to trade the SPX? Start by tracking a widely followed spread, like the difference between the ICE BofA High Yield Corporate Bond Index yield and the 10-year Treasury yield. You can find this data on financial websites like Bloomberg, Yahoo Finance, or through trading platforms like Thinkorswim. Look at historical trends to get a sense of what’s “normal.” For example, high-yield spreads typically range between 3% and 6% in stable times but can spike above 10% in crises. If spreads are below 3%, it might suggest an overheated market, while above 6% could indicate growing fear.
When trading, use credit spreads as a confirmation tool alongside other indicators like moving averages or the VIX. Suppose you’re considering a bullish SPX trade because the index is above its 200-day moving average, and economic data looks solid. Check the credit spread. If it’s narrowing or stable at a low level (say, 3-4%), it supports your bullish thesis, as it suggests the bond market sees low default risk and economic strength. You might buy SPX call options or an ETF like SPY to capitalize on potential upside. But if spreads are widening rapidly, even if the SPX is climbing, it’s a red flag. You might hold off on new longs or consider protective puts to hedge against a potential pullback.
Let’s walk through a practical example. Imagine it’s mid-2025, and the SPX is trending upward, but you notice the high-yield spread has jumped from 4% to 6% over a few weeks. Economic reports mention slowing growth, and corporate earnings are mixed. This widening spread suggests bond investors are getting nervous, possibly due to rising interest rates or weakening corporate balance sheets. You might decide to scale back on aggressive SPX longs or look for bearish opportunities, like buying put options, expecting the SPX to correct as the market catches up with the bond market’s pessimism. Conversely, if spreads are tightening and economic data is improving, you might lean into bullish trades, confident that the credit cycle is supporting stock market growth.
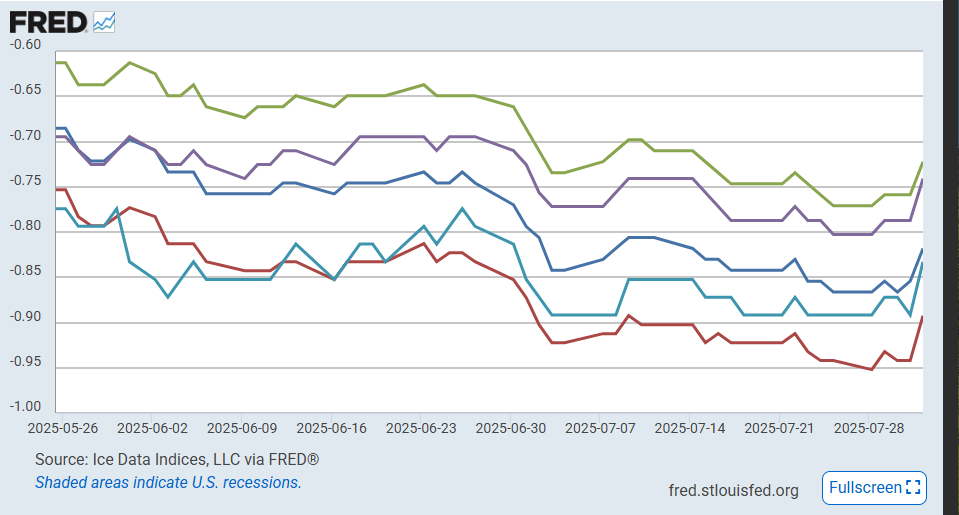
Let’s take a look at the current credit spread, processed into an output gap. As you can see, we’re still in a negative output gap, which supports the ongoing bullish cycle in the SPX and other equity indices. Once we see an adjustment or spike in the spread, it can signal a shift, and that’s when we adjust our market positioning accordingly. Keep in mind: FRED data is delayed by 1–2 days, so it’s important to use real-time data when drawing conclusions from credit spreads.
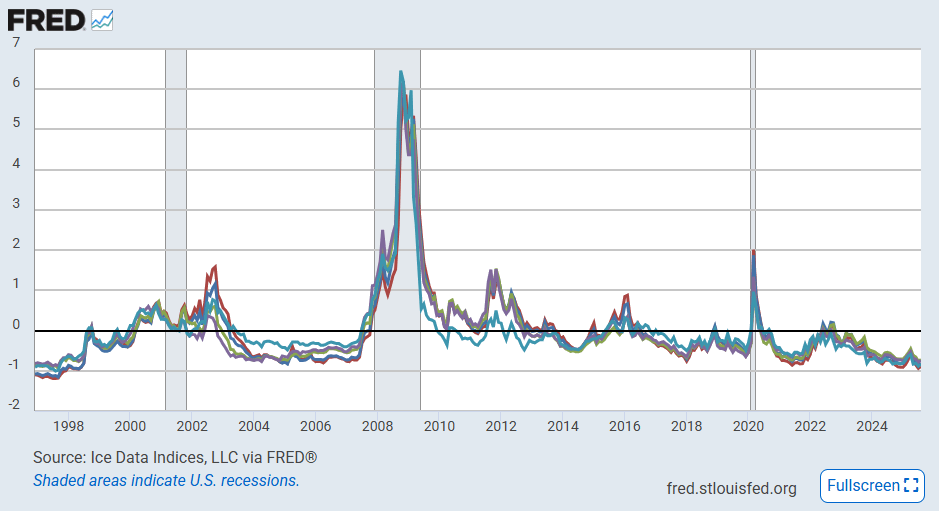
One thing to keep in mind is that credit spreads don’t predict exact timing. They’re more like a weather forecast than a clock. A widening spread doesn’t mean the SPX will crash tomorrow, it means conditions are shifting, and you should stay alert. Combine spreads with other tools, like technical analysis or macroeconomic data, to refine your entries and exits. Also, focus on relative changes rather than absolute levels. A spread moving from 3% to 4% in a month is more telling than a static 4% reading without context.
The beauty of credit spreads is that they give you a glimpse into the bond market’s collective wisdom, which often sees risks or opportunities before stocks do. By learning to read this signal in the context of the credit cycle, you can make smarter, more informed trades on the SPX. It’s like having a conversation with the economy, listen closely, and it’ll tell you when to lean in or step back.
Enjoyed this article? Access highly trusted training content and premium market insights by investing in a membership to become part of our elite community.