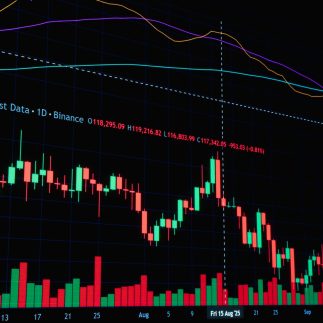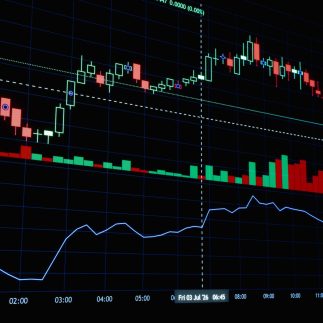
This article delves into sophisticated trading strategies facilitated by the utilization of Sierra Chart’s Time Price Opportunity (TPO) profile, contrasting these methodologies with traditional charting techniques. The focus is on how institutional traders can leverage the unique features of the TPO profile to gain a competitive edge in the financial markets.
Introduction:
The TPO profile, a cornerstone feature in Sierra Chart’s analytical toolset, offers a multidimensional view of the market, integrating time, price, and volume. This contrast sharply with conventional charting methods, which predominantly hinge on price action and standard volume metrics.
1. Market Structure Analysis:
The TPO profile excels in providing a granular view of market structure, enabling traders to identify high-liquidity zones and significant price levels. Institutional traders employ this to ascertain potential areas of support and resistance that are not readily apparent in traditional candlestick charts.
2. Value Area Trading:
A key strategy revolves around the ‘value area’, the range where a significant portion of trading activity occurs. Traders can establish positions near the boundaries of the value area, capitalizing on the market’s propensity to revert to these high-activity zones.
3. Volume-at-Price Analysis:
Unlike conventional volume histograms that display volume over time, the TPO profile illustrates volume at specific price levels. This enables a more nuanced understanding of supply and demand dynamics at distinct price points, crucial for formulating entry and exit strategies.
4. Identifying Market Imbalances:
The TPO profile is adept at highlighting market imbalances. Institutional traders scrutinize these for potential reversal points, a strategy less directly pursued with traditional charts.

5. Auction Market Theory Application:
The profile’s structure facilitates a deeper application of auction market theory principles. This includes identifying periods of ‘price discovery’ and ‘price acceptance’, enabling traders to gauge the strength of market trends.
Comparative Advantage:
The TPO profile, by offering a composite view of market dynamics, provides a more holistic approach to trading than classic charting methods. While traditional charts are instrumental in trend analysis and pattern recognition, the TPO profile offers a richer tapestry of market sentiment and behavior.
Conclusion:
In conclusion, Sierra Chart’s TPO profile equips institutional traders with a powerful tool for dissecting market dynamics. By leveraging these advanced strategies, traders can gain a nuanced understanding of market behavior, which is critical in the high-stakes realm of institutional trading. This report underscores the necessity for a diverse analytical approach, combining the strengths of various charting methods for optimal market analysis and decision-making.