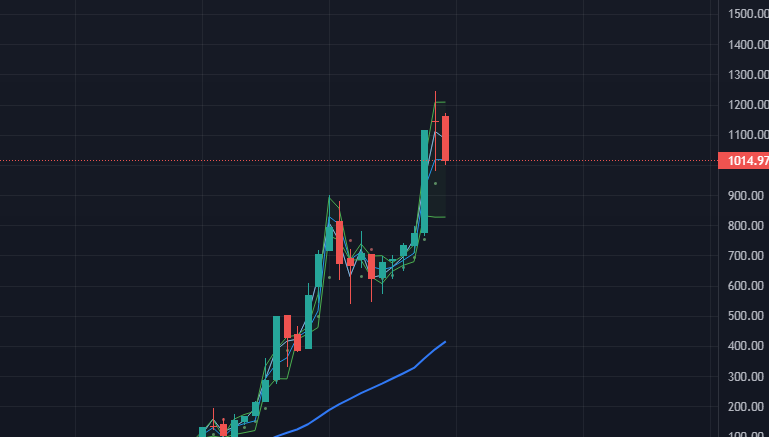
Tesla TSLA keeps tumbling and fell about 11% at the early beginning of this month. The monthly periodicity still trending higher and might giving the lower chart perspective a bullish bias.
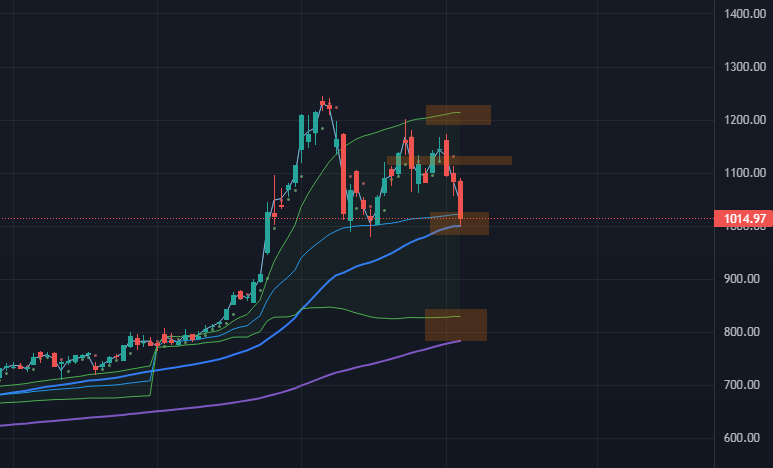
The daily perspective of Tesla fell about 6.4% on Friday’s session. The market was hitting the Quarter’s VWAP and prior swing lows from the middle of Novembers to initiate possible core buyers. To be noted is the EMA50 as supportive level as well. Sellers may be targeting the Quarterly DVAL level.
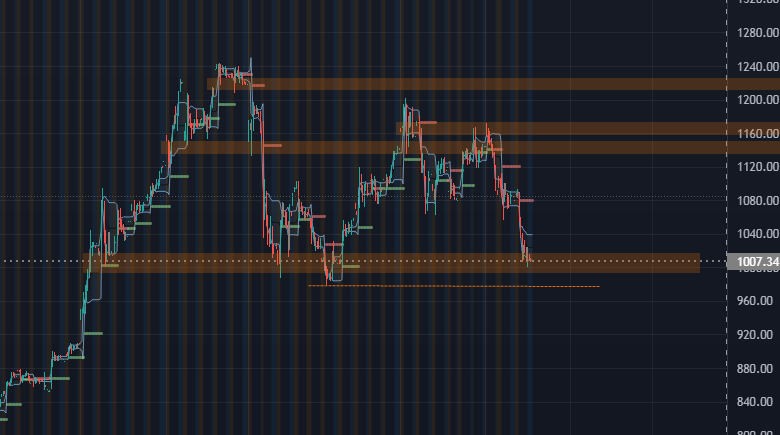
The hourly perspective trending lower while testing the mentioned swing lows back from November. The market might targeting the lows for absorption purposes, hence swing failures around this particular area is possible. Upper distributions may be serving as selling levels.