An asymmetric opportunity demonstrates itself when the risk of a trade is skewed positively mutiple times by the profit oppotunity present.
Risk is calculated from a structural stop location in the market which is visual with the Market Profile two-dimensional structure. A visual exit location is then used to calculate the potential profit.
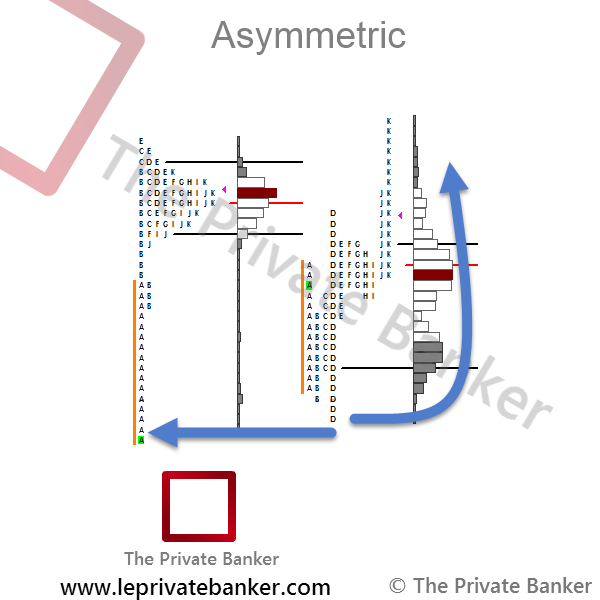
In the following figure we can identify the buying tail which got filled to revisit the POC of the prior p-shaped TPO profile. Risk placement would be below the buying tail’s low while targeting the mentioned mean of the upper distribution of the prior profile with the idea to fill the single print or low volume area.