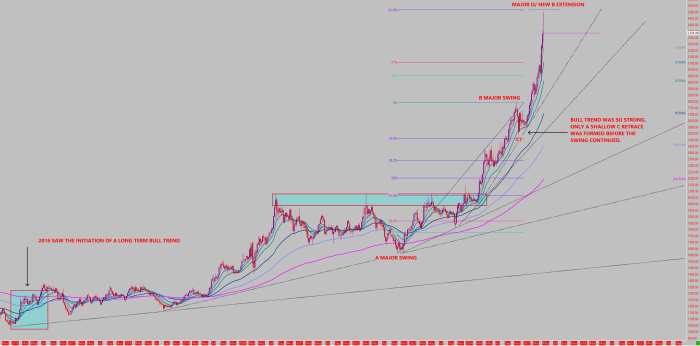
Gold weekly bar chart – initiation of the LT bull trend formed in early 2016, and nine years in has gained enormous momentum. We have just completed a multi year Fibonacci major swing, the bulls were so strong, only a very shallow 23.6 C retrace was formed in Nov 2024.
We now see a Doji attempting to form this week’s candle. Eyes on where the week closes as to what type of Doji we confirm. (Subject to change) This would indicate bearish momentum ahead, that would converge with both a technical D extension that was achieved, and possible near term easing geopolitical tensions.
Initial near term SUPP at $3221.00 & $3108.25 as per this WKLY bar chart. The bulls remain inside every trend line & for now, trading above short term EMA’s. Only an accepted drive below ST EMA’s would suggest a wider correction in Gold on a technical basis. After so many recent ATH, we do expect ST profit taking.