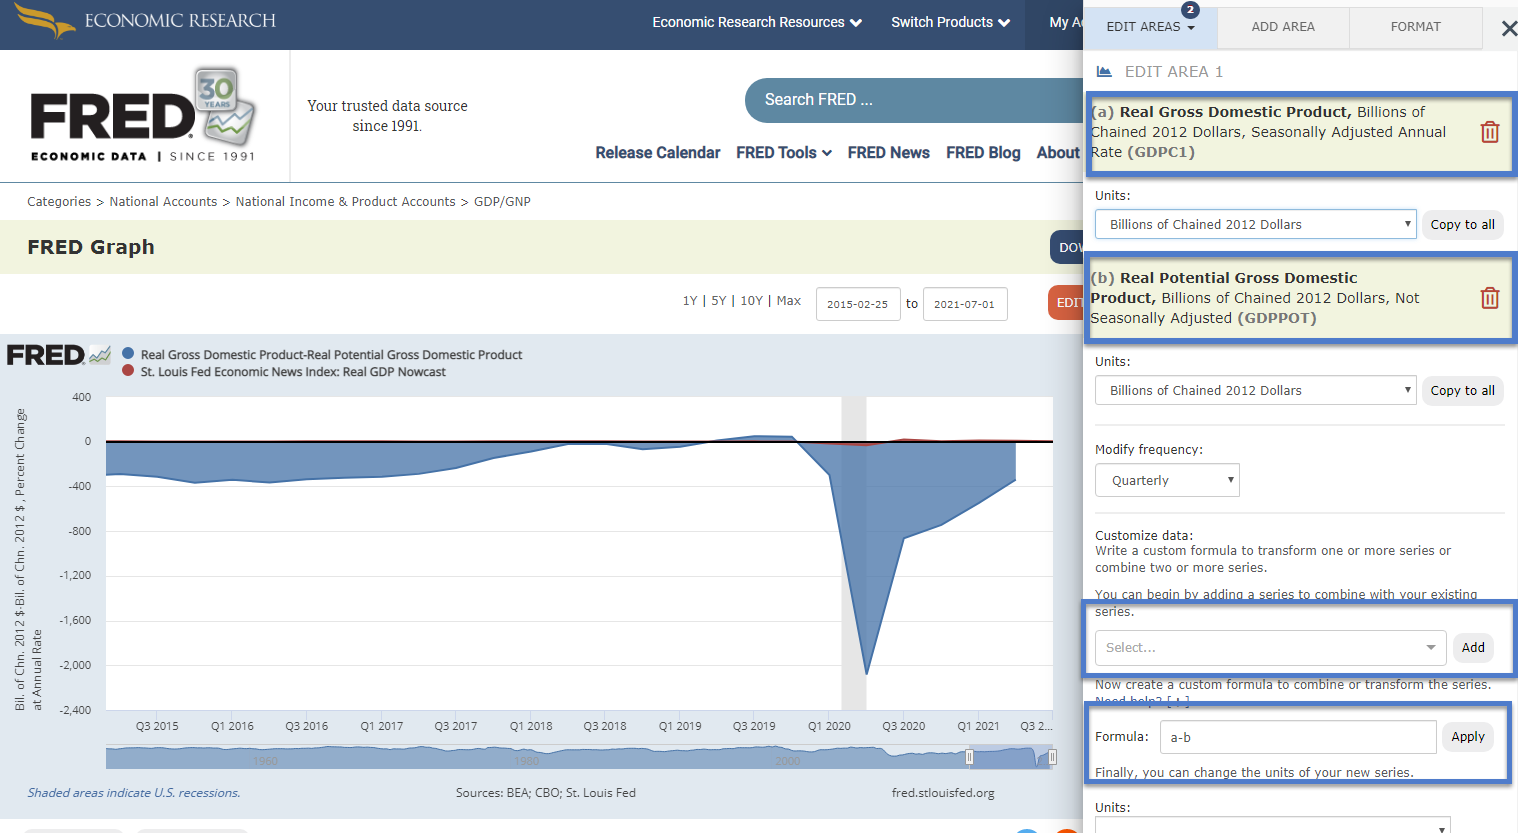
The real GDP and potential GDP output gap stood by around minus 399 for Q2 of this particular Year with Real GDP Nowcast of around plus 9.03. Possible forecast is around plus 5.14. Stimulus, spending and boosting might keeping on with the result of a pushing demand to higher stock prices and inflation as the output gap between the subtracted GDP data is still in the contraction area.
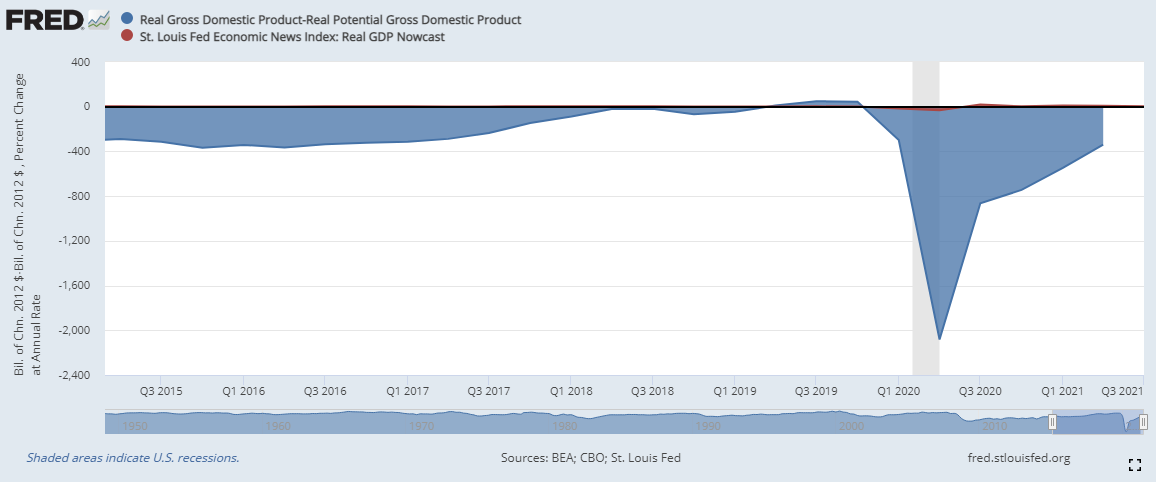
The higher inflation might lead to a lower U.S dollar which could boost Gold and Oil prices, central bank market operations and maybe higher interest rates could defend a lower dollar.
The E-mini S&P 500 still keeping on with the monthly bullish momentum which occurs since about a 7 month rally higher. Traders seemingly looking to reaload or to add to their core positions in case of slight retracements on the medium-term perspective.
You can create your own chart with simply open the realGDP with a FRED search while adding and subtracting the potential realGDP data set. Additionally you can add the GDPnow or GDP Nowcast to your chart for forecasting data.