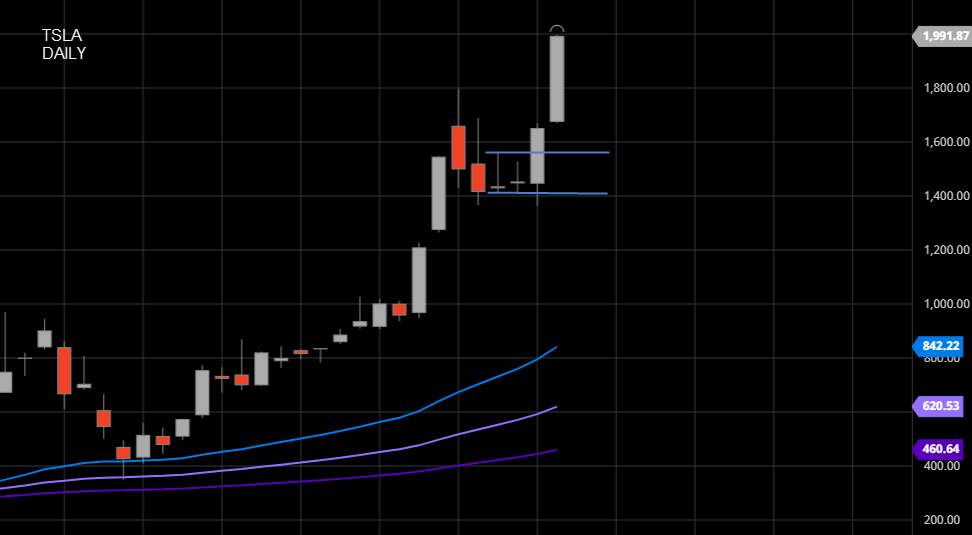
TSLA is a impressive stock and looking at the weekly periodicity we can observe a technical sign for this surge.
Firstly we can identify a double inside week. This pattern tends to have a higher probability to take out both extremes.
The following week ideed took out both extremes and closed as an outside bar which is a sign for a possible change in the overall market context, in this particular case from balanced to trending.

Additionally we were able to observe a bullish inside week break out pattern.