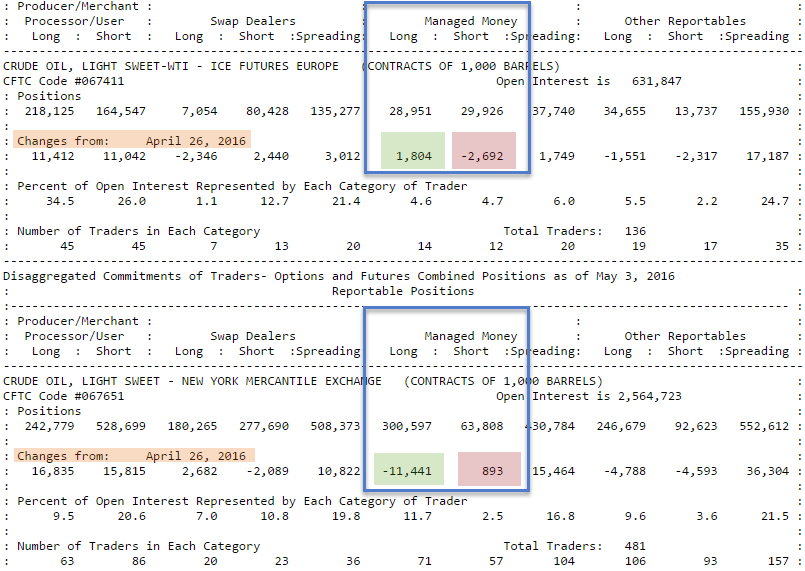
As usual, we will start off with the CFTC Commitments of Traders (COT) ICE and Nymex as well as Options and Futures combined report. With looking at the report, we can observe that the Managed Money sector were net selling 7,838 contracts of WTI Crude oil in the week ended May 3, with quite a combination of a dominated long liquidation and a small short covering. Looking at these numbers, we guess that Money Managers were adjust their risk exposure and scaled some of their profitable long positions out of the market in the previous week.
Short Covering: Closing a short position (buy order).
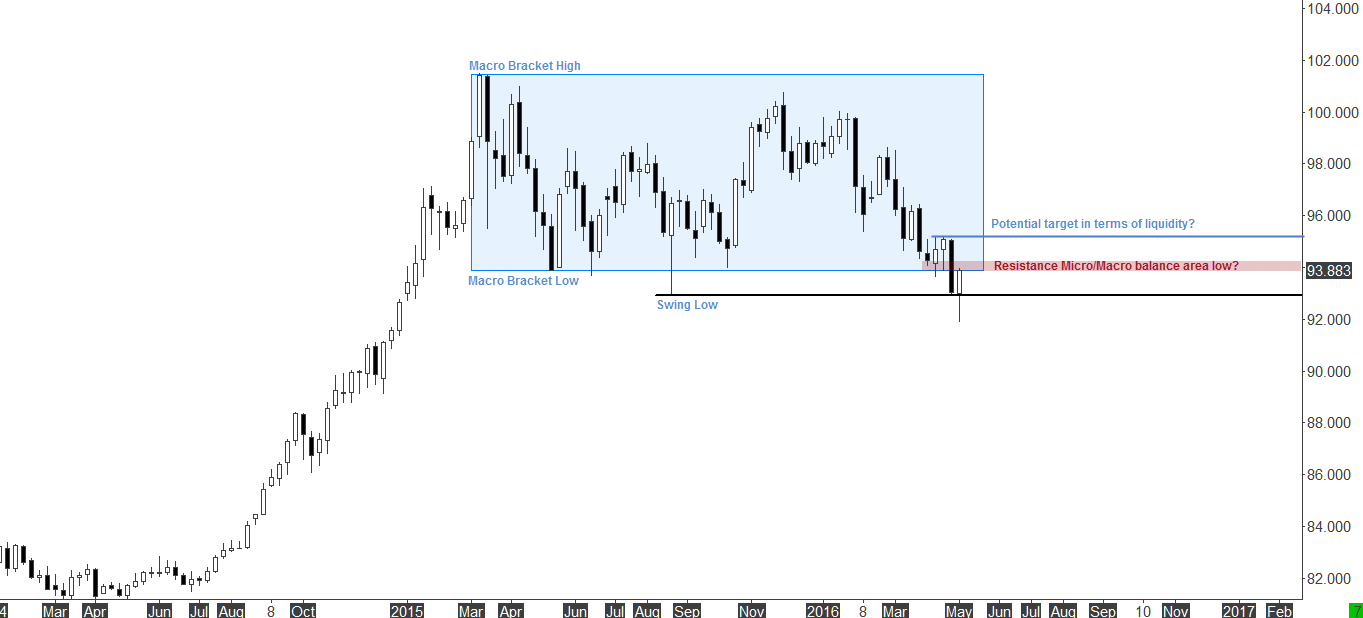
The US Dollar Index (ICE) broke below the macro balance area low and took out a swing low in the previous two weeks. However, it seems the market found some liquidity below that swing low and brought us back to the macro bracket low. In terms of liquidity the market could target the next liquidity area to the upside. We should keep in mind the potential resistance levels around the current micro/macro balance area low.
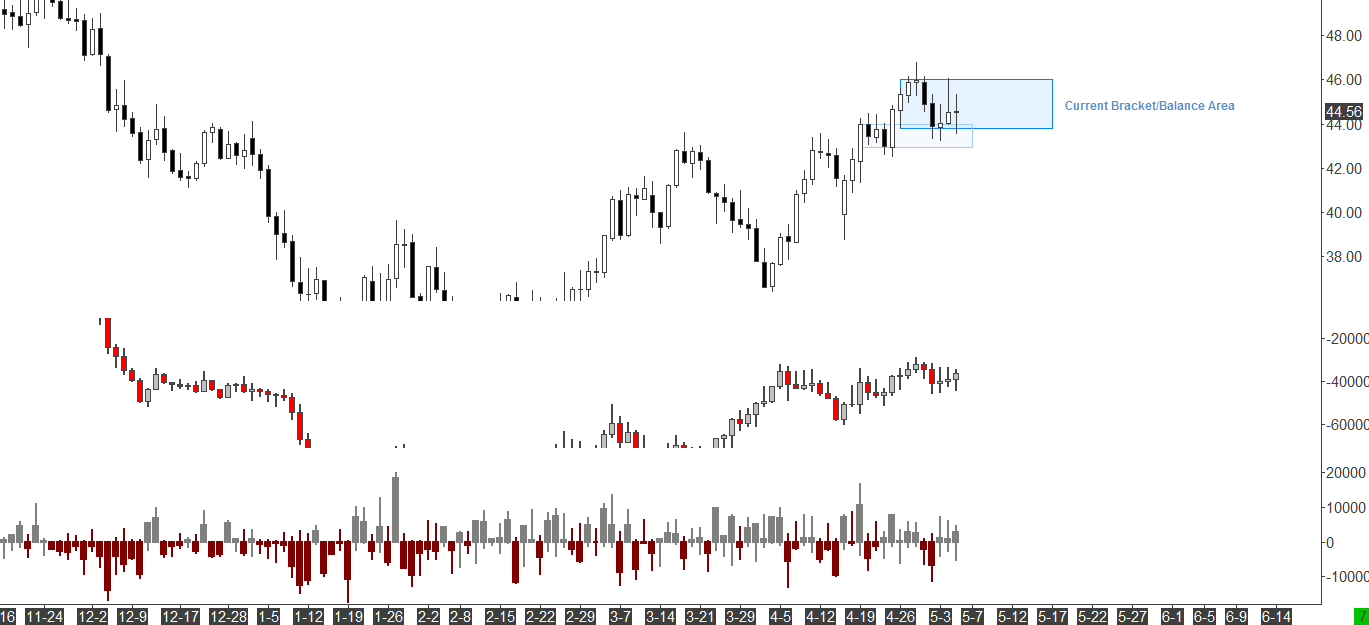
Now let us dig into the Crude oil charts. First, we should take a look at the plain daily perspective in order to figure out the current market behavior. Looking at this timeframe, we can identify a quite balanced behavior with support at the bracket low and the previous balance area high as well as precise resistance a the bracket high. Also, the cumulative delta bars are pretty balanced since three days as you can see on the following figure:
Now let’s moving forward to the Volume Profiles. The important thing to remember when looking at Volume Profiles are identifying areas of acceptance and rejection. When the market is in an acceptance area, market participants are in agreement on price while in rejection areas, one side of the market is not interested in price based upon the overall perception of value.
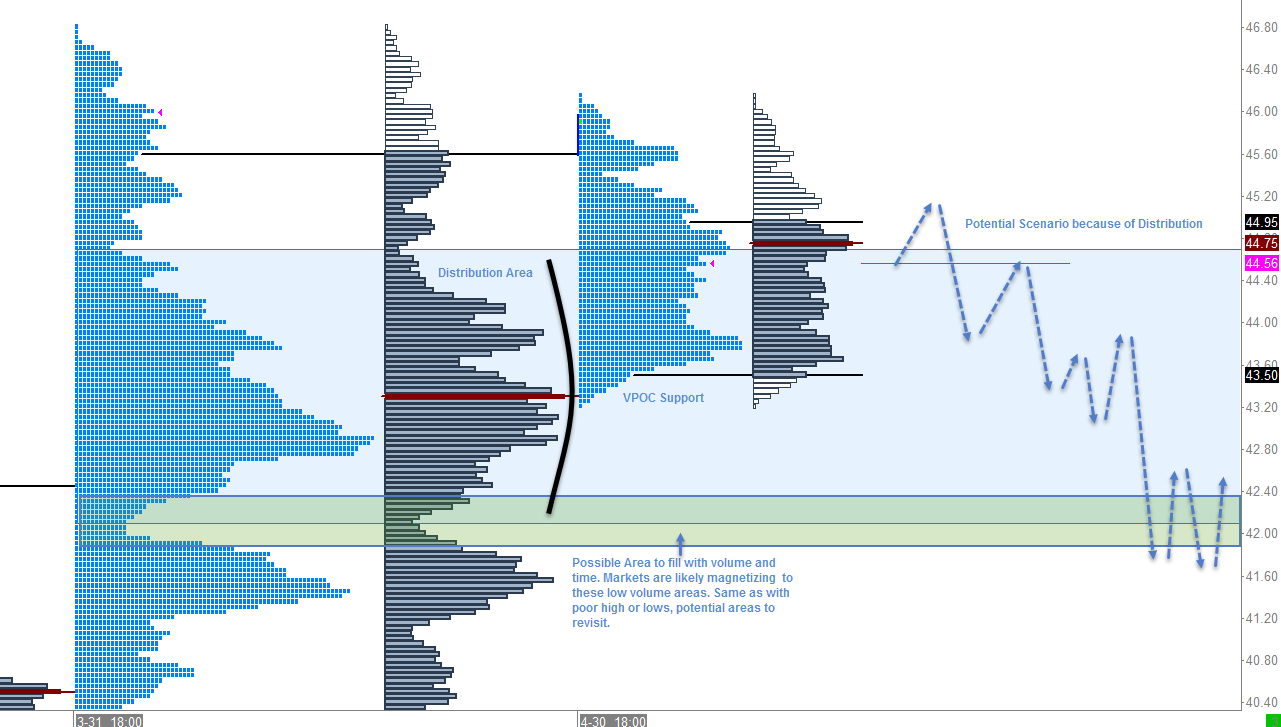
Looking at the monthly TPO (Time Price Opportunity) and the Volume profile, we can observe that this month opened above the previous value close area but quickly migrated back to value. The next thing to identify is the strong positive support from the volume point of control (VPOC – point where the most volume occurred). Important to note is the distribution/acceptance area and the low volume/time area as well as an unsecured low in the previous month’s profile.
A potential bearish scenario would be to test the distribution low, filling the low volume/time area and revisit the mentioned unsecured low. A bullish scenario would be a quick break to the upside with support from the distribution high.
You must be open-minded here and react to market generated information. A whole lot of stuff can change the perception of context and value during the days. With that said, have a potential conclusion for the next days and weeks but have a open mind for a plan B. For example a break above value would signal a change in market context and we must adjust our analysis in realtime etc.
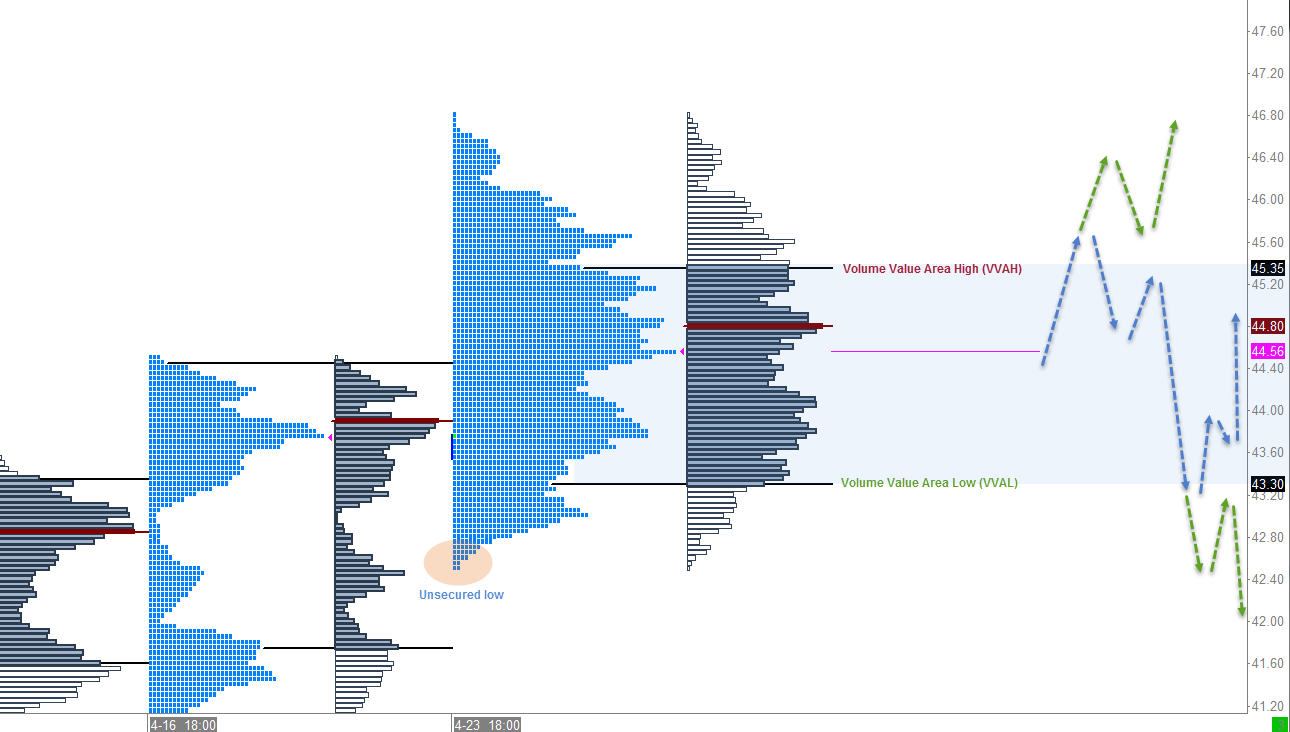
Anyway, let’s move forward to the weekly profiles. Now we can observe a balanced inside week. The mentioned monthly VPOC support is confluent with the previous week’s VPOC, that would somewhat explain the stong support from that area/level. An open inside of the balanced range would conclude a rotational behavior in the next week. In a rotational situation we want to lean us on the value extremes such as VVAH and VVAL. Plan B: A break above balance would continue the exploration to higher prices, break below balance to lower price. To mention is also an unsecured low for a possible revisit.

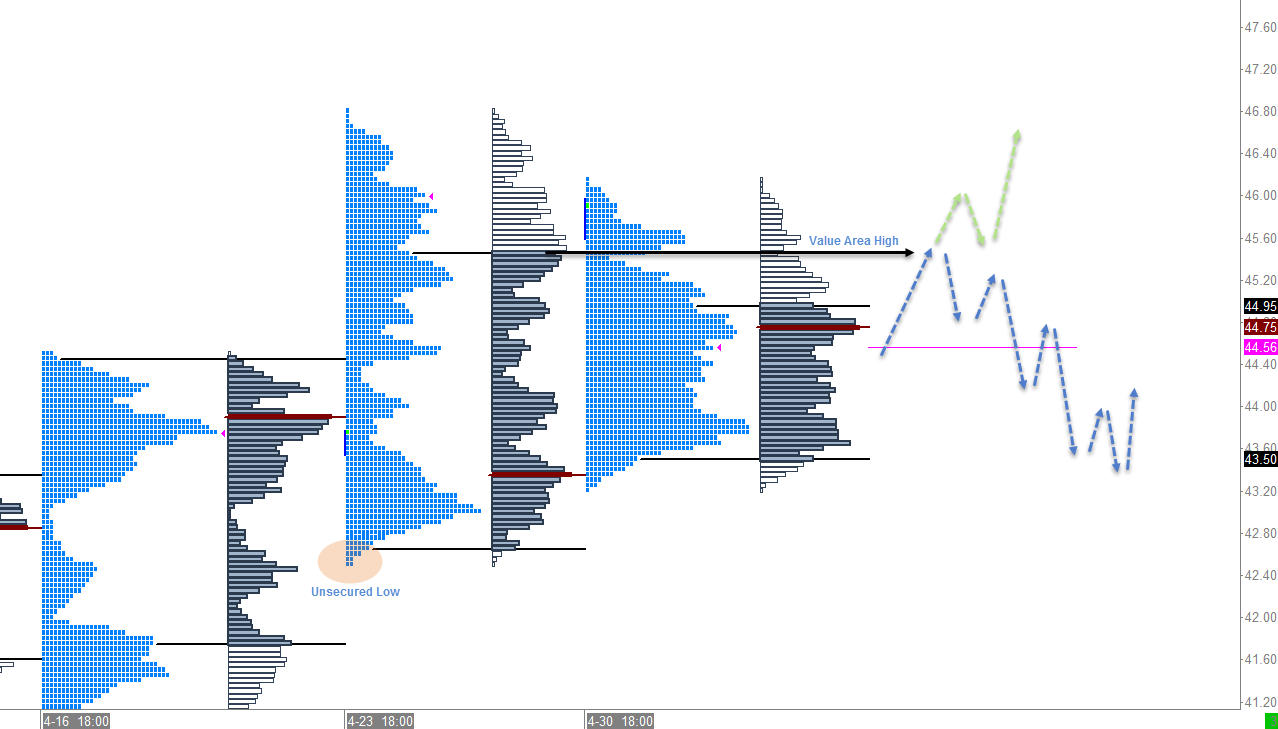
Actually, we can merge the two previous profiles because of the inside week. With that we have a beautiful balanced profile with an unsecured low as potential level to revisit. Again, an open inside of balance would indicate a rotational behavior. In that case we want to lean us on the value extremes VVAH as resistance and VVAL as a support level. Take a look a the following figure to having a visual idea:
There is some conflicting information with the daily profiles now. We can identify an unsecured high and the volume profile is quite a double distribution. However, depending on the open we will see some rotational behavior here as well. Then we should go with the break. Moreover, I will observe the reaction to the VPOC as this could serve as a key level either supportive or as a rejection point to the downside. The overnight session will be definitely an important factor to conclude the further development on the day.

In summary we can conclude a potential rotational behavior with leaning us on the balance/value extremes as support and resistance until we break either higher or lower.